The idea: a trade-off that lasts only while expectations stand still
In 1958 A. W. Phillips plotted a century of British data. Years with low unemployment had fast wage growth, and years with high unemployment had slow wage growth. Economists soon drew the same picture with price inflation on one axis and unemployment on the other. It looked like a menu: pick a bit more inflation and get fewer people out of work. Milton Friedman and Edmund Phelps argued in 1967–68 that the menu changes as soon as people order from it. The 1970s proved them right.
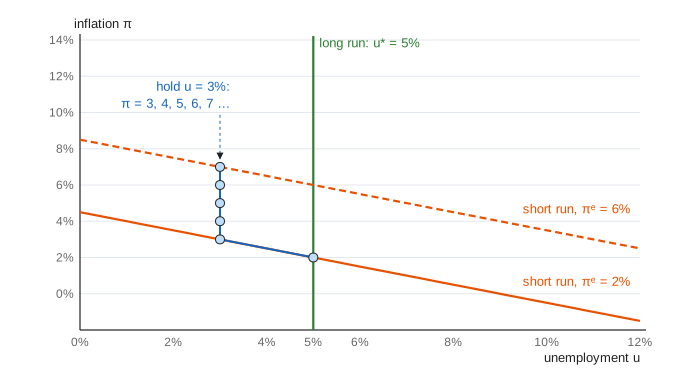
The page uses one line: π = πᵉ − 0.5 × (u − 5) + shock. Here π is inflation, πᵉ is the inflation people expect, u is unemployment and 5% is the natural rate u*. Each press of Next Year plays one year at the unemployment rate you picked.
The short-run curve: wages, jobs and prices
Each year, wages are set with two things in mind. The first is the inflation people expect: nobody wants a raise that prices eat up. The second is how tight the labour market is. When unemployment is below 5%, firms compete for workers and pay a little extra; when it is above, workers accept less. Firms pass wage costs on, so prices rise by about as much as wages. Read along one orange line and lower unemployment means higher inflation. That is the short-run Phillips curve.
Expectations shift the curve
The orange line crosses the natural rate at πᵉ. If people expect 2%, the curve passes through (5%, 2%). If they expect 6%, it passes through (5%, 6%), four points higher everywhere. With adaptive expectations, people expect this year whatever they saw last year (πᵉ = last year's π). So any year in which inflation beats expectations moves next year's curve up.
The natural rate and the vertical long-run curve
Hold unemployment at 3% (Demo: hold unemployment at 3%). In year 1, inflation is 2 + 1 = 3%. In year 2, people expect 3%, so inflation is 4%. Then 5%, 6%, 7%: inflation accelerates as long as unemployment stays below u*. This is why u* is also called the NAIRU, the non-accelerating inflation rate of unemployment.
Go back to 5% and inflation stops rising, but it does not fall: it stays at whatever people now expect (Demo: back to the natural rate). Every inflation rate is possible at u* = 5%, and no other unemployment rate can last. That is the vertical long-run Phillips curve, the green line.
Disinflation and the sacrifice ratio
Bringing inflation down from 10% with adaptive expectations means running the curve backwards. Unemployment at 9% takes 2 points off each year: 8, 6, 4, 2 (Demo: disinflation the hard way). That is 4 extra points of unemployment for 4 years, 16 point-years, to remove 8 points of inflation. The sacrifice ratio is 16 / 8 = 2. In 1979–82 the Federal Reserve under Paul Volcker went through something similar: unemployment peaked near 11% and inflation fell from over 13% to under 4%.
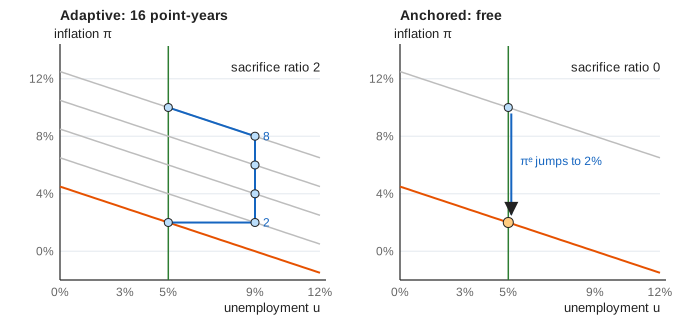
If people believe the central bank instead, expectations jump to the new target. The curve drops at once and inflation falls to 2% with no rise in unemployment (Demo: credible disinflation). Real disinflations land between the two cases, and how close they get to the cheap one depends on credibility. That is why central banks publish targets and work so hard to keep expectations anchored.
Supply shocks and stagflation
An oil price jump adds 3 points to this year's inflation at any unemployment rate. If policy lets unemployment rise to 6% to push back, inflation is still 2 + 3 − 0.5 = 4.5%. Inflation and unemployment are both higher than before: stagflation (Demo: oil shock). With adaptive expectations the 4.5% feeds into next year's wage deals, and unemployment has to stay above 5% for years to work it off. The AD–AS page shows the same shock as prices against output.
History in one picture
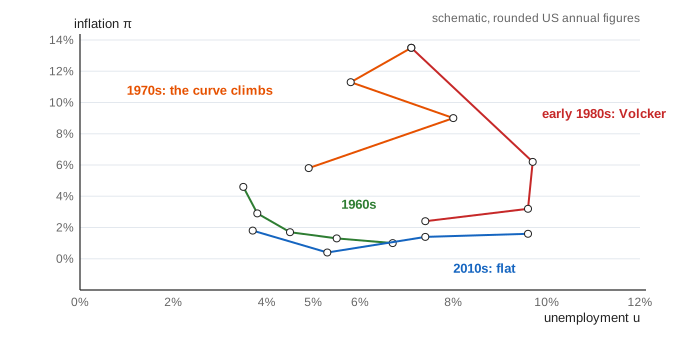
In the 1960s expectations were close to fixed, so years fell along one curve (Demo: the 1960s curve breaks, first four years). Policy pushed unemployment below 4%, inflation rose, and people started to expect it. The curve then climbed through the 1970s, helped up by the oil shocks of 1973 and 1979. The Volcker disinflation brought it back down at a high cost in jobs.
Anchored expectations and the flat curve
After the 1990s, inflation targets were believed, and expectations stayed near 2% whatever last year's inflation was. With πᵉ fixed, the economy moves along a single curve again. Low unemployment in 2018–19 raised inflation only a little and did not make it accelerate. Switch expectations to anchored and hold unemployment at 3%: inflation sits at 3% year after year. The danger is that anchoring is itself a belief. The 2021–23 surge tested it, and central banks raised rates hard to keep it.
What the page leaves out
The real curve is not a straight line, and u* is not a known constant: it moves with demographics, unions, matching and policy, and it can only be estimated with wide error bands. Expectations here are either purely backward-looking or fully trusting; real ones mix the two and differ across people. The page lets policy choose unemployment directly, but in reality a central bank moves interest rates and the effect on jobs arrives with long, variable lags (see Monetary Transmission). There is no productivity growth, and wages and prices rise one for one.