The idea: credit feeds on itself, then unwinds
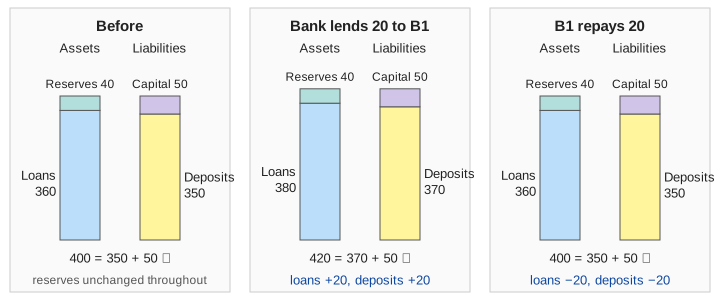
Most money is a bank deposit, and most deposits are made by bank lending. When a bank grants a loan it writes two entries at once: a loan the borrower owes the bank, and a new deposit in the borrower's account. When the loan is repaid, both disappear. So the amount of money rises and falls with the amount of credit, and credit rises and falls with how willing banks are to lend.
Banks lend against collateral, and collateral has a price. That price depends partly on how much is lent against it. This loop makes credit move in long waves, the credit cycle: years of easy lending and rising prices, then a bust with defaults, forced sales and years of paying debt down. The page runs a small, deterministic economy through that cycle, one year per tick.
The bank's balance sheet
The canvas treats all banks as one. Its assets are reserves (money held at the central bank) and loans. Its liabilities are deposits, plus the owners' stake, capital (equity). The two sides are always equal:
reserves + loans = deposits + capitalEvery event changes both sides by the same amount:
| Event | Assets | Liabilities + capital |
|---|---|---|
| New loan of 20 | loans +20 | deposits +20 |
| Borrower repays 20 | loans −20 | deposits −20 (money destroyed) |
| Borrower pays 3 interest | — | deposits −3, capital +3 |
| Bank pays costs or dividends | — | capital −x, deposits +x |
| Default: loan 130, building sold for 100 | loans −130 | deposits −100 (the buyer pays), capital −30 (the loss) |
The capital ratio is capital divided by loans (real rules use risk-weighted assets; here every loan weighs 100%). It is the cushion that absorbs losses. Below the minimum, 8% on the page, the bank must stop growing. Notice that reserves never limit a loan in the model: the Bank of England put it plainly in 2014, "commercial banks create money, in the form of bank deposits, by making new loans" (Demo 1: a loan creates a deposit, repaying destroys it).
Collateral and standards: the financial accelerator
The bank lends against a building up to a maximum loan-to-value (LTV), its main lending standard. Each year it adjusts the standard to what it has just seen: prices rose and capital is healthy, so it eases (+5 points); prices fell or losses arrived, so it tightens. Easier standards mean more credit, the new deposits are spent bidding for the same twelve buildings, and prices rise again. Economists call this self-reinforcing loop the financial accelerator (Bernanke, Gertler and Gilchrist; Kiyotaki and Moore). In a bust it runs the other way.
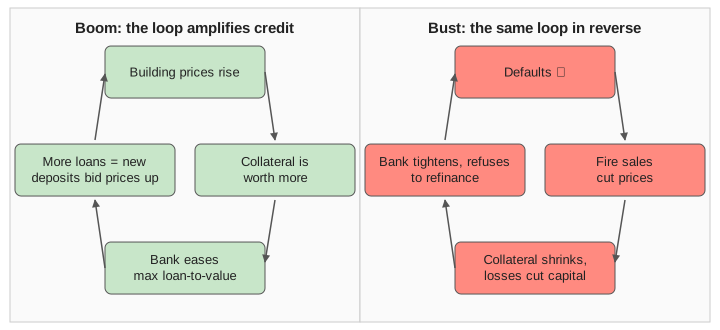
On the canvas, credit-to-GDP climbs from 90% to 163% in eight years and the building price from 100 to 154, while the fundamental value (the rent stream valued at the interest rate) only reaches 127 (Demo 2: expansion, Demo 3: Minsky boom). The capital ratio drifts down from 13.9% to about 10%: loans grow faster than the bank's retained profit, so the bank's own leverage rises too.
Minsky: hedge, speculative and Ponzi borrowers
Hyman Minsky sorted borrowers by whether their income covers their debt payments. Each card on the canvas shows a borrower's rent, debt, interest and scheduled principal (a 20-year loan) and the badge for its class:
| Class | Test (rent y, interest I, principal due) | What it depends on |
|---|---|---|
| Hedge (green badge) | y ≥ I + principal | nothing: it pays the loan off from income |
| Speculative (orange) | I ≤ y < I + principal | the bank rolling over the principal |
| Ponzi (red) | y < I | the bank lending the interest, which it only does while the collateral keeps rising |
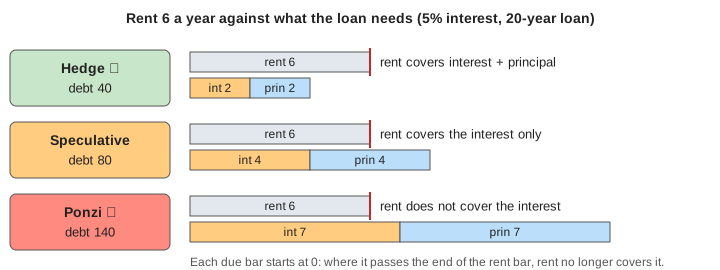
In a long boom more borrowers move down this table. Rents grow slowly but debt grows with the price of the collateral, and lenders who have seen no losses for years accept thinner margins. Minsky's phrase was "stability is destabilizing": the calm years build the fragile balance sheets. By year 8 the page has 6 hedge, 5 speculative and 1 Ponzi borrower; let it run with no shock at all and the most indebted borrowers default anyway in year 13, when their debt grows past what the collateral can carry (Demo 6: no shock needed).
The phases of the cycle
| Phase | On the canvas |
|---|---|
| Expansion | prices rise, max LTV eases from 60% toward 95%, loans and deposits grow, everyone is hedge |
| Boom | max LTV ≥ 85% or Ponzi borrowers appear; credit-to-GDP far above its start |
| Shock / bust | a rate rise or price fall: the bank refuses to lend Ponzi borrowers their interest; they default, buildings are fire-sold at 75% of the price, losses hit capital, each forced sale cuts the price 5% |
| Contraction | no new lending, prices falling; loans are repaid and deposits shrink (deleveraging) |
| Repair | no new lending while the bank rebuilds capital from profit; prices stop falling |
| Recovery | capital back above the minimum and prices rising: lending restarts, and the next expansion begins |
In Demo 4: a rate rise at the peak the policy rate goes from 5% to 8% after year 8. Every interest bill jumps (4 Ponzi borrowers instead of 1), and higher rates lower the fundamental price. Prices fall, standards tighten, and in years 11 and 12 the four Ponzi borrowers B9–B12 default. Losses cut the capital ratio to 3.9%, below the minimum, so the bank stops lending entirely. Credit-to-GDP falls from 178% to 81%. Demo 5: full cycle then cuts the rate to 4%: two years of repair, then recovery.
The credit-to-GDP chart is the one regulators watch. The Bank for International Settlements found that a large gap between credit-to-GDP and its long-run trend is one of the best early warnings of a banking crisis, and the Basel III countercyclical capital buffer is keyed to it.
Shocks and policy
The shock matters less than the balance sheets it hits. The same rise from 5% to 8% after only two years of growth, when every borrower is still hedge, causes no default at all; it just stops the expansion (Demo 7: the same rate rise without a boom first). The page's macroprudential switch is an affordability test: lend only what the borrower could still repay if rates were 3 points higher, like the Bank of England's mortgage stress test. With it on, nobody becomes speculative or Ponzi, credit-to-GDP peaks near 120%, and the 8% rate rise brings no defaults (Demo 8). Other real tools work on the same loop: caps on loan-to-value, and higher capital requirements in the boom that can be released in the bust.
See also Monetary Transmission (how the policy rate reaches loans and prices), Money Circular Flow, Flight to Quality (what investors do in the bust) and Flow of Funds.
What the page leaves out
A real banking system has many banks that settle payments in reserves and can run on each other, a central bank that lends to them and sets the rate in response to the economy, deposit insurance, risk weights, loan loss provisions made before a default, and borrowers who also lose jobs and income in a recession (here rents never fall). Prices here have one simple rule and no expectations. Defaulted borrowers leave the model for good, and the bank is never recapitalized by the government. The numbers are a toy chosen to make the phases visible, not an estimate of any economy.