The idea: one short rate, a whole economy
A central bank controls only one price directly: the interest rate on overnight money. Yet it aims at spending, jobs and inflation. The monetary transmission mechanism is the chain in between. A rate decision moves money-market rates the same day, then bond yields, loan rates, stock and house prices and the exchange rate. Those change what households and firms spend, which opens or closes the output gap (actual output minus what the economy can produce without overheating). The gap, plus expectations, moves inflation, a year or more later.
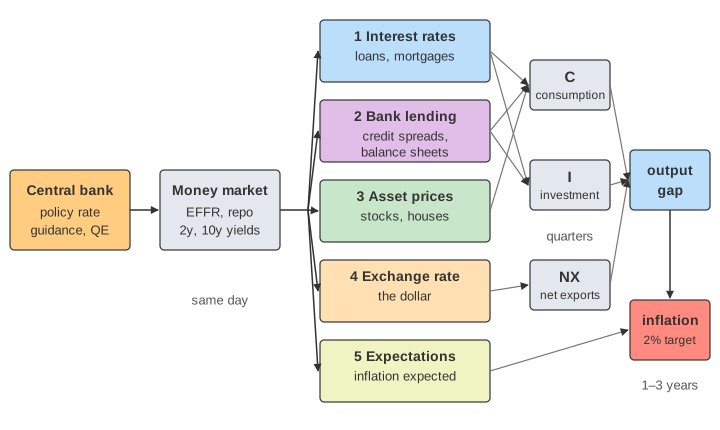
The canvas follows one decision through this chain. The top row is the chain itself, left to right. The bottom row is a quarter-by-quarter timeline, so you can see the lags.
How the Fed sets the rate
The Federal Reserve announces a target range for the federal funds rate, 25 basis points wide (100bp = 1 percentage point). It does not trade at that rate itself. It sets two administered rates: interest on reserve balances (IORB), paid to banks on the reserves they keep at the Fed, and the overnight reverse repo (ON RRP) rate, paid to money-market funds that lend cash to the Fed overnight. No bank lends reserves for much less than IORB, and no fund lends for less than ON RRP, so the effective federal funds rate (EFFR) stays inside the range.
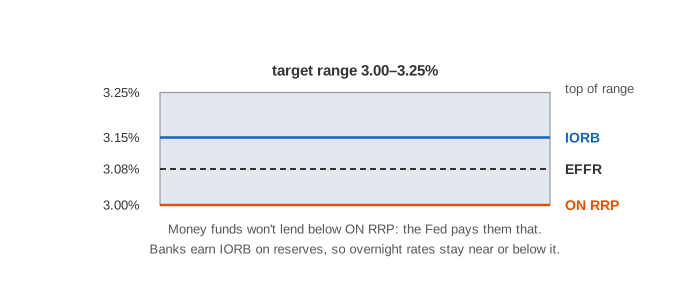
The page starts at 3.00–3.25%: ON RRP 3.00%, IORB 3.15%, EFFR 3.08%, and assumes that is the neutral rate of this economy, so nothing moves until the bank acts. A hike shifts all three by the same amount (Demo: hike 25bp).
Expectations and the yield curve
Borrowers rarely pay the overnight rate. Mortgages, corporate bonds and bank loans are priced off longer yields, and a 2-year yield is roughly the average overnight rate markets expect over the next 2 years plus a term premium (extra pay for tying money up). So what moves markets is news about the expected path of the policy rate, not the rate itself.
- A surprise hike of 25bp that markets expect to last moves the 2-year by +25bp. In the page's model the 10-year moves +10bp, because beyond 2 years rates are expected to drift back toward neutral.
- Forward guidance changes the expected path without touching today's rate. Demo: forward guidance only promises four 25bp cuts: the EFFR stays at 3.08% in Q0, but the 2-year falls 81bp at once (3.28% → 2.47%). When the cuts happen in Q1–Q4 they are already priced: the 2-year moves only by the window rolling forward. Output and inflation end almost the same as an immediate 100bp cut.
- A move that markets already expected does little; a surprise does a lot. That is why central banks communicate so carefully.
The channels
| Channel | What moves (same day or soon) | Who spends less after a hike | Speed in the page |
|---|---|---|---|
| 1 Interest rate | loan rate (2-year + spread), mortgage rate (10-year + spread) | firms (machines, buildings), home buyers, car and durable buyers | slow: builds over 4–6 quarters |
| 2 Bank lending & balance sheets | credit spread: as collateral (stocks, houses) loses value, lenders charge more and lend less | small firms and households that depend on banks | slow |
| 3 Asset prices & wealth | stocks at once (−8% per +1 point on the 10-year), houses over quarters | households who feel poorer consume less | fast |
| 4 Exchange rate | the dollar rises (+4% per +1 point on the 2-year) | foreign buyers of exports; imports get cheaper, which also lowers prices | medium |
| 5 Expectations | expected inflation edges down if the bank is credible | wage and price setters | goes straight into inflation |
The balance-sheet channel (part of row 2) is the link between rows 2 and 3: when asset prices fall, borrowers have less collateral and weaker balance sheets, so the spread they pay rises on top of the market rate. The bank lending channel is the lenders' side: banks whose funding gets dearer, or whose capital is thin, ration credit.
The page's coefficients are chosen to be plausible, not estimated. With them, Demo: cut 100bp raises the output gap to a peak of +0.70% in Q5 and inflation to a peak of 2.51% in Q9; Demo: hike cycle 4 × 25bp takes the gap to −0.69% (Q7) and inflation down to 1.49% (Q11). Estimates from central-bank models for a 100bp move are of a similar order, with wide uncertainty.
Long and variable lags
Milton Friedman described monetary policy as working with "long and variable lags". The page shows why. Financial prices jump on day 0. Spending changes only as plans change: a firm finishes the factory it started, a family has already signed its mortgage. In the model each channel builds its push on demand a fifth of the way per quarter, and once firms and households have adjusted their stock of machines, houses and cars, part of the push fades. So the gap peaks after about 5–7 quarters. Inflation follows the gap with inertia and peaks 3–4 quarters after it.
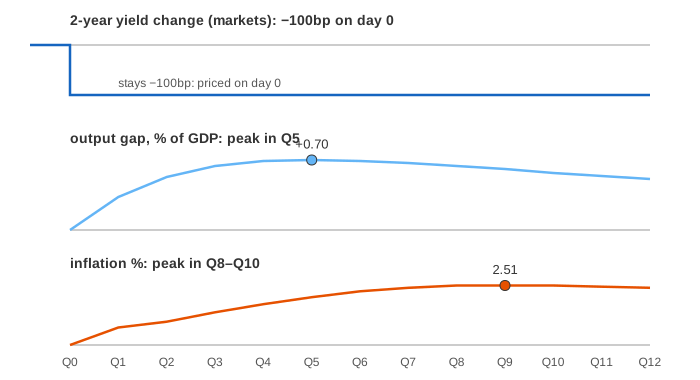
This is why central banks have to act on forecasts. A bank that waits until inflation itself turns has already let 1–2 years of pressure build. The lags are "variable" in reality because the size of each channel depends on the state of the economy: how much debt is at floating rates, how leveraged households are, how open the economy is.
QE, the zero lower bound and blocked channels
A policy rate cannot go much below zero: people could hold cash instead. At the zero lower bound the interest-rate tool is blocked; this is a liquidity trap. Demo: blocked: liquidity trap, then guidance + QE starts with a recession (output gap −3%, inflation 1%, range 0–0.25%). The requested 50bp cut is refused. Two tools still work through the long end of the curve:
- Forward guidance: markets had priced lift-off in 3 quarters. Promising to hold at zero for 8 quarters takes the 2-year from 0.74% to 0.28%.
- Quantitative easing (QE): the bank buys long bonds with new reserves. Fewer long bonds in private hands means a lower term premium: in the page each $500B lowers the 10-year term premium by 25bp. Mortgage rates fall, stocks and houses rise, and the dollar dips.
With both, the gap closes to −0.03% by Q12 and inflation is back to 1.83%. QE alone (Demo: QE at the zero lower bound, $1T) leaves the gap at −0.21% and inflation at 1.64%; with no action the shock alone would leave −0.43%.
Channels can also be blocked by the financial system. In Demo: blocked: banks impaired, cut 100bp, banks short of capital pass on only 30% of a fall in market rates. Market yields fall as much as in the normal cut, and stocks and the dollar react the same, but the loan rate falls only 36bp instead of 108bp and the mortgage rate 18bp instead of 48bp: the gap peaks at +0.43% instead of +0.70%, and inflation at 2.35% instead of 2.51%. This is roughly what happened after 2008, and why central banks then also repaired banks and bought assets directly.
See also Liquidity Preference (how the demand for money sets the short rate), The Credit Cycle (how lending and collateral feed each other), The Quantity Theory of Money and Global Dollar Liquidity (the exchange-rate channel seen from abroad).
What the page leaves out
The central bank in the page does not react to the economy: rates stay where you put them, while a real bank follows a rule of thumb (like the Taylor rule) and reverses course as the gap and inflation move, which is a big part of why real responses fade. The model has no supply shocks, no fiscal policy, no wages or unemployment, no foreign central banks, and fixed coefficients where real ones vary over time and with the state of the economy. Real QE also works through signalling and bank reserves, and quantitative tightening, negative rates and the details of reserve scarcity (the move from a corridor to a floor system) are left out. The numbers are illustrative, not estimates.