The idea: every payment is someone's income
Money does not disappear when it is spent. It moves to someone else. When a household buys bread, the baker's sales go up; the baker pays wages, rent and profits out of those sales, and that is income for other households, who spend it again. This loop is the circular flow of income and spending. The page follows it around five sectors: households, firms, the government, the financial sector (banks and the bond market) and the rest of the world.
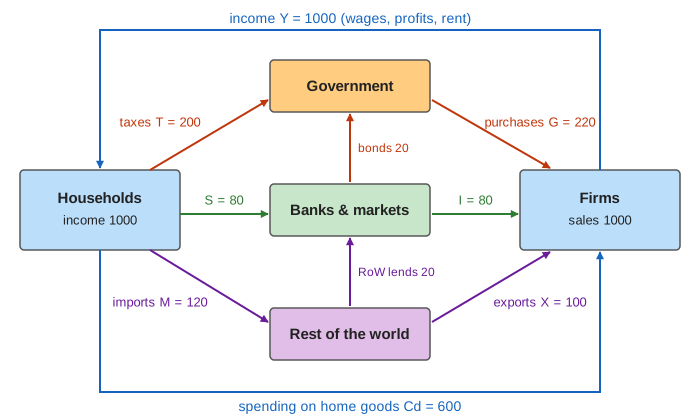
A round on the canvas is one trip around the loop. Firms pay out what they sold last round as income Y. Households pay tax, save, and spend the rest, part of it on imported goods. The amounts are dollars per round, with simple fixed behaviour so every number can be checked by hand (Demo: one round around the loop).
| Step | Rule | Start |
|---|---|---|
| income paid by firms | Y = last round's sales | 1000 |
| taxes | T = t·Y, t = 20% | 200 |
| saving | S = s·(Y − T), s = 10% | 80 |
| imports | M = m·C, m = 1/6 of consumption C = 720 | 120 |
| spending on home goods | Cd = C − M | 600 |
| investment, government purchases, exports | fixed: I, G, X | 80, 220, 100 |
| firms' sales = next round's income | Cd + I + G + X | 1000 |
Leakages and injections
Of each dollar of income, only part is spent again on home-made goods. The rest leaks out of the loop: saving S, taxes T and imports M. Other spending injects money into the loop without coming out of this round's household income: firms' investment I, government purchases G and exports X.
- Leakages = injections (400 = 400 at the start): firms sell exactly what they paid out, and income stays the same.
- Leakages > injections: firms sell less than they paid out. Goods pile up unsold, firms cut output, and next round's income is lower.
- Leakages < injections: firms sell more than they made, run down stock, and raise output.
Income keeps moving until leakages equal injections again. That level is the equilibrium income Y*. Since each leakage grows with income, there is always one such level.
Where the leaked money goes
Leaked money is not lost; it changes hands. Saving is deposited at banks, and banks lend it to firms that invest. If the government spends more than it collects, it borrows the difference by selling bonds. If we import more than we export, foreigners end up holding the extra dollars, and they keep them as deposits or bonds here. Taxes are net of transfers (pensions, unemployment pay), which on this page are inside T.
Count every flow once from each side and an accounting identity falls out. Firms' sales are Cd + I + G + X; households' income is Cd + S + T + M. If income equals sales, then S + T + M = I + G + X, which rearranges to
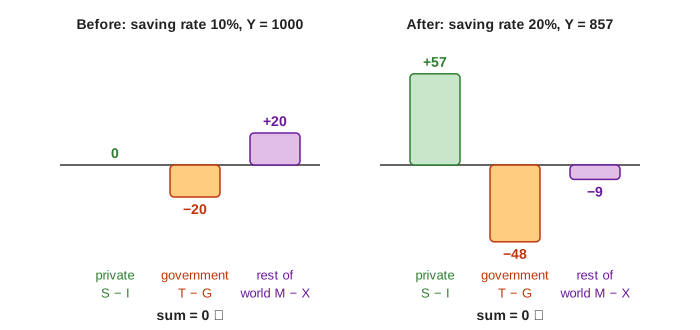
Each bracket is a sector's net lending: the private sector's surplus, the government's budget balance, and the rest of the world's surplus with us. One sector can spend more than its income only if another spends less. At the start the private sector is balanced (S − I = 0), the government runs a deficit of 20 and the rest of the world lends us 20 (a trade deficit). The Sector balances panel draws the three bars; they always add to zero. The Stocks panel adds the flows up: household deposits plus foreign claims always equal firm debt plus government debt.
Identity versus behaviour
The identity holds in every round, even when the economy is not settled, because of one item: unsold goods. If firms paid out 1000 but sold only 960, they made 40 of goods that nobody bought. National accounts count that as inventory investment (unplanned), so measured investment is I + 40 and the balances still add up. The page shows this as S − I − unsold. What the identity does not tell you is which side moves. The behaviour does: firms answer unsold goods by producing less, and income falls until the planned leakages equal the planned injections.
The multiplier
At the start, each dollar of income brings 0.8 × 0.9 × 5/6 = 0.6 of home spending: 20% goes in tax, 10% of the rest is saved, a sixth of what is spent goes abroad. So 0.4 leaks out each round. A change of ΔA in injections changes income by ΔA in the first round, 0.6·ΔA in the next, 0.36·ΔA after that, and so on. The sum is the multiplier:
and equilibrium income is Y* = k·(I + G + X) = 2.5 × 400 = 1000. The demos change one injection at a time:
| Demo | Change | Income after it settles | Balances (S − I, T − G, M − X) |
|---|---|---|---|
| Investment falls | I 80 → 40 | 900 (−100 = 2.5 × −40) | +32, −40, +8 |
| Government spends more | G 220 → 260 | 1100 | +8, −40, +32 |
| Austerity | G 220 → 200 | 950 | −4, −10, +14 |
| Exports fall | X 100 → 60 | 900 | −8, −40, +48 |
Two things stand out. Spending 40 more raises the deficit by only 20, because income and taxes rise with it; cutting 20 to close a deficit of 20 closes only half of it, because income and taxes fall (Demo: austerity). And the multiplier is smaller in an economy with high taxes and lots of imports, since more of each dollar leaks out at once. Real estimates of fiscal multipliers are usually between 0.5 and 2 and depend on how close the economy is to full capacity and on what the central bank does in reply; the page holds interest rates and prices fixed.
The paradox of thrift
One household that saves more ends up with more savings. If all households save more at once, their spending is someone else's income, so income falls. In the closed economy (no government, no trade) the only leakage is saving and the only injection is investment I = 100. Raising the saving rate from 10% to 20% halves equilibrium income, from 1000 to 500, and total saving ends up exactly where it started, at 100 = I (Demo: paradox of thrift in a closed economy). If firms also invested less when sales fall, saving would even end lower.
In the open economy the fall is softer, because taxes and imports fall with income and absorb part of it: income goes from 1000 to 857 and saving rises from 80 to 137, not the 160 households planned at the old income. The government's deficit widens from 20 to 48 and the trade deficit turns into a small surplus (Demo: households save more). This is the mechanism behind the worry about "balance-sheet recessions": when households and firms all try to pay down debt at once, someone else, usually the government, has to run the matching deficit or income falls.
Related pages
This page tracks flows of income. How the same flows show up in the financial accounts, as sector lending and borrowing, is on Flow of Funds. How the central bank's interest rate moves investment and spending, the injections held fixed here, is on Monetary Transmission. Why lending itself rises and falls with the economy is on Credit Cycle. The link between the amount of money and prices is on Quantity Theory of Money.
What the page leaves out
Prices and wages are fixed, so all changes are in output, not inflation. Interest rates are fixed and investment does not react to sales or to borrowing costs (no accelerator, no crowding out). Exports do not depend on our income and there is no exchange rate. Banks only pass saving on: in reality bank loans create deposits, and lending is limited by capital and demand, not by a pool of saving. Depreciation, retained profits, government transfers as a separate flow, interest payments on the debt, and the central bank are all left out.
References
IMF Finance & Development: What Is Keynesian Economics? (aggregate demand and the multiplier)
OpenStax, Principles of Macroeconomics 3e (the Keynesian perspective, the expenditure multiplier)
Wynne Godley, Seven Unsustainable Processes (Levy Economics Institute): the three sector balances
Bank of England Quarterly Bulletin: Money creation in the modern economy