The idea: money moves between buckets
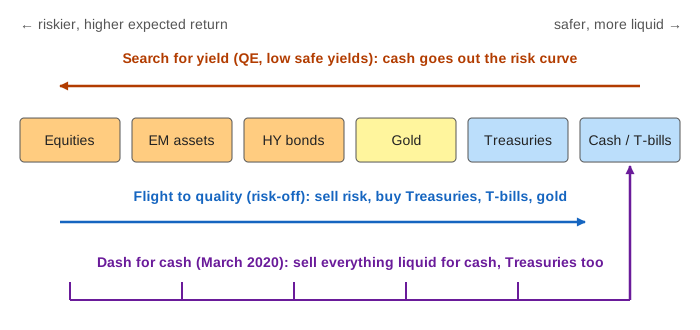
Big investors (pension funds, insurers, mutual funds, households through their savings) do not hold one asset. They spread their money over buckets: equities, emerging-market (EM) assets, high-yield (HY) corporate bonds, gold, Treasuries and cash or T-bills. Each bucket has a target weight. When prices change, or when the investors change their minds about risk, money moves from one bucket to another, and those flows move prices, yields and spreads. The page follows one aggregate investor sector with $1,000bn, its trades with dealers, and the central bank.
The page's numbers are made up but of a sensible size, and the rules are fixed, so every number can be checked:
| Bucket | Start | Calm target | What moves its price |
|---|---|---|---|
| Equities | $400bn | 40% | the equity index |
| EM assets | $100bn | 10% | 10y yield + EM spread (duration 5); −1% per point of the dollar index |
| HY bonds | $150bn | 15% | 10y yield + HY spread (duration 4) |
| Gold | $50bn | 5% | the gold price |
| Treasuries | $250bn | 25% | 10y yield (duration 8) |
| Cash / T-bills | $50bn | 5% | value fixed; earns the T-bill yield |
A bond's duration says how much its price moves when its yield moves: with duration 8, a yield 0.50 points lower means a price 4% higher. A spread is the extra yield over Treasuries that a riskier borrower pays; a wider spread means a lower price.
Target weights and rebalancing
If equities rally 20%, nobody has traded, yet the equity weight has drifted from 40% to 44.4%. Rebalancing trades back to target: each bucket moves to target weight × total − value now. So investors sell what went up and buy what went down. Rebalancing leans against price moves, which is why large month-end and quarter-end pension rebalancing is watched by traders.
| Demo | Total | Equities | Every other bucket |
|---|---|---|---|
| Stocks rally 20% | $1,080bn | sell $48bn ($480bn → $432bn) | buy: EM $8bn, HY $12bn, gold $4bn, Treasuries $20bn, cash $4bn |
| Stocks fall 20% | $920bn | buy $48bn ($320bn → $368bn) | sell the same amounts |
These flows are small and two-sided (other investors trade the other way), so on the page rebalancing trades at the current prices without moving them.
QE and the portfolio balance channel
In quantitative easing (QE) the central bank buys Treasuries and pays with newly created reserves, which reach investors as bank deposits. Two things happen (Demo: QE and the portfolio balance channel):
- The Fed's bid pushes Treasury prices up: the 10y yield falls 50bp to 2.50%, and every bond reprices with it. Investors swap $100bn of Treasuries for $100bn of cash.
- They now hold too much cash and Treasuries that pay little. This is the portfolio balance channel: the central bank has taken safe, long-term assets out of the market, so investors must hold something else. With safe yields low, they search for yield: on the page their targets move from 40/10/15/5/25/5 to 44/12/18/5/16/5 and the cash goes out the risk curve.
The result: the Fed bought only Treasuries, yet equities end 4.7% higher, the HY spread falls from 400bp to 311bp, the EM spread from 300bp to 242bp, and the dollar index slips to 98.1. Lower borrowing costs for firms and higher asset prices are how QE eases conditions beyond the Treasury market. See Monetary Policy Transmission for the other channels.
Flight to quality
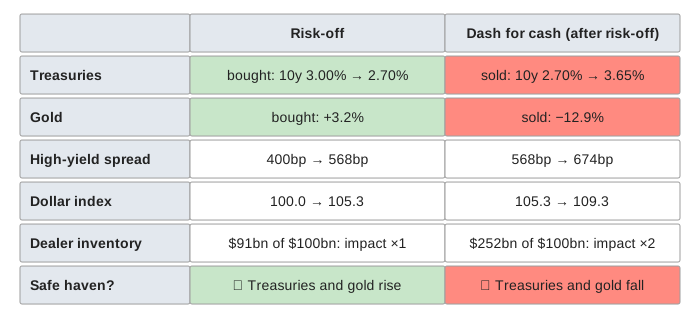
A shock (a bank failure, a war, a pandemic) makes investors want less risk all at once. In Demo: risk-off, flight to quality equities first drop 15% and the VIX (the market's measure of expected stock volatility) jumps to 40. The targets switch to 30/5/10/7/33/15: investors sell $58bn of equities, $53bn of EM and $56bn of high yield, and buy $60.2bn of Treasuries, $91bn of T-bills and cash and $15.8bn of gold. This is a flight to quality:
- safe yields fall: the 10y from 3.00% to 2.70%, T-bills from 2.00% to 1.54%;
- credit and EM spreads widen: HY 400bp → 568bp, EM 300bp → 459bp;
- the dollar rises (100 → 105.3) because selling EM assets means buying dollars, and gold rises 3.2%.
Who takes the other side: dealers and price impact
Every sale needs a buyer. When everybody sells risk at once, the buyers are mostly dealers (the market-making arms of big banks) and the few investors who step in. They only take the assets at lower prices, and the page models this as price impact per $1bn of one-sided flow: equities 0.1%, HY and EM spreads 3bp, the 10y yield 0.5bp, gold 0.2%, T-bills 0.5bp. Dealers' balance sheets are limited by capital and leverage rules; on the page they can take on $100bn. Above that, the same flow moves prices twice as much. In the risk-off demo investors move $91bn into cash, so dealers take on $91bn of securities, just under capacity.
Dash for cash (March 2020) and the backstop
In March 2020 the scare became a scramble for cash: funds faced redemptions, leveraged traders faced margin calls, and borrowers abroad needed dollars. You sell what you can sell, and the most liquid asset is Treasuries. So, unusually, Treasuries were sold in a crisis and the 10y yield rose (from about 0.5% on March 9 to about 1.2% on March 18) while stocks were falling. Gold fell too.
In Demo: dash for cash (March 2020), Fed backstop, after the risk-off step, equities fall another 12%, the VIX hits 75 and the targets move to 34% cash. Investors sell $95.3bn of Treasuries and $32.3bn of gold. Dealers now hold $252bn against $100bn of room, so impact doubles: the 10y yield jumps 95bp to 3.65%, gold falls 12.9%, the HY spread reaches 674bp and the dollar index 109.3.
The central bank stops the run as market maker of last resort, as the Fed did in March 2020:
- policy rate cut to 0.25% (T-bills fall to the floor);
- $200bn of Treasury purchases from dealers: inventory drops to $52.4bn and the 10y yield falls 100bp to 2.65%;
- dollar swap lines with foreign central banks, so foreigners get dollars without dumping US assets: dollar index −4;
- credit facilities that could buy corporate bonds: HY spread −200bp to 474bp, EM spread −100bp, VIX 45, equities +10%.
See Global Dollar Liquidity for swap lines and offshore dollar funding, and Liquidity Preference for why people want money itself when uncertainty jumps.
When bonds do not hedge (2022)
A flight to quality works when the shock is fear about growth: Treasuries rise while stocks fall. When the shock is inflation and rate hikes, both fall. In Demo: 2022, stocks and bonds fall together equities fall 20% and Treasuries 10% (the 10y yield rises 125bp to 4.25%, which also pushes down HY and EM prices). The total drops to $881.3bn and rebalancing has to buy both stocks and bonds with cash. This is roughly what happened in 2022, the worst year for a 60/40 stock-bond portfolio in decades.
For how risk appetite builds up and unwinds over years, see The Credit Cycle.
What the page leaves out
Real investors are not one sector with one set of targets: some (leveraged funds, foreign reserve managers) sell into a panic while others (pension funds rebalancing) buy. The page uses fixed price-impact coefficients and fixed target changes instead of a model of expected returns and risk; real impact depends on market depth, volatility and who is trading. It leaves out leverage and margin calls in detail (the Treasury cash-futures basis trade unwinding in 2020), money-market fund runs, the term premium versus expected short rates in the 10y yield, currency hedging, and the issuers who supply new bonds and shares when investors search for yield.