The idea: the interest rate is the price of giving up money
Money (cash and bank deposits) is the most liquid thing you can own: you can spend it at once, at a known value. A bond pays interest, but to spend it you must sell it first, at whatever price the market gives that day. In The General Theory (1936) Keynes argued that the interest rate is the reward for giving up liquidity. People's wish to hold money, their liquidity preference, meets the amount of money the central bank supplies, and the rate settles where people are content to hold exactly the money that exists.
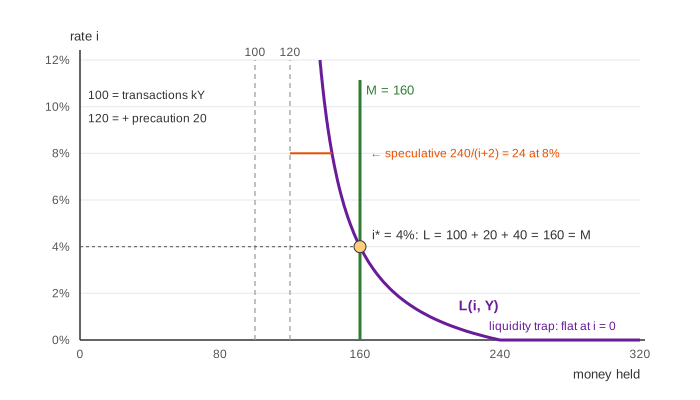
The page uses one small, fixed set of numbers so every demo can be checked by hand. Money demand is L(i, Y) = 0.25·Y + precaution + 240 / (i + 2), with income Y = 400, precaution 20 and the rate i in percent. The central bank starts with M = 160, so the rate is 4.0%.
The three motives for holding money
| Motive | Why people hold money | Depends on | Page's numbers |
|---|---|---|---|
| Transactions | To pay for things between paydays: wages come monthly, bills come daily. | Income Y (more spending needs more money on hand) | k·Y = 0.25 × 400 = 100 |
| Precautionary | A buffer for the unexpected: a lost job, a late customer, a repair. | Uncertainty and fear (and income) | 20 calm, 40 fearful |
| Speculative | To avoid losses on bonds when rates are expected to rise, and to be ready to buy when they are cheaper. | The interest rate i: the higher it is, the more holding money costs | 240 / (i + 2): 40 at 4%, 60 at 2%, 120 at 0% |
The first two do not depend much on the rate; they set where the curve stands. The third makes the curve slope down: when bonds pay 10%, keeping money idle costs a lot of lost interest, so people hold little of it; when bonds pay 1%, it costs almost nothing. In the canvas, each of the six holders needs one sixth of the transactions and precautionary money, and the speculative money is split by the share shown under its name. The hedge fund, which watches rates closely, holds the largest speculative share.
Money supply and open market operations
The money supply M does not depend on the rate in this model: the central bank decides it, so it is a vertical line. It changes M with open market operations. To add money it buys bonds from banks and investors and pays with newly created reserves and deposits (Demo: buy bonds, the rate falls). To take money out it sells bonds and the buyers pay with money, which then leaves circulation (Demo: sell bonds, the rate rises). The flying packets on the canvas show both sides of the trade.
Finding the rate: L = M
Right after a purchase of 20, people hold M = 180 but at 4% want only 160. Nobody can make the extra 20 disappear by spending it, since it only moves to someone else. What they can do is swap it for bonds. Many buyers push bond prices up, and a higher price means a lower yield. As the rate falls, holding money gets cheaper and people want more of it. At 2% they want 240 / 4 = 60 of speculative money, L = 100 + 20 + 60 = 180 = M, and the buying stops. The red gap on the canvas is the excess money (or the shortage); it shrinks to zero as the rate walks to the new level.
| Demo | Change | Rate | Bond price |
|---|---|---|---|
| Buy bonds | M 160 → 180 | 4.0% → 2.0% | 100.00 → 117.97 |
| Sell bonds | M 160 → 150 | 4.0% → 6.0% | 100.00 → 85.28 |
| Income rises | Y 400 → 440, L shifts right by 10 | 4.0% → 6.0% | 100.00 → 85.28 |
| Panic, then supply money | precaution 20 → 40, then M 160 → 180 | 4.0% → 10.0% → 4.0% | 100.00 → 63.13 → 100.00 |
| Rate targeting | Y 400 → 440, then M 160 → 170 | 4.0% → 6.0% → 4.0% | 100.00 → 85.28 → 100.00 |
| Liquidity trap | M 160 → 200 → 240 → 280 | 4.0% → 1.0% → 0% → 0% | 128.42 → 140.00 → 140.00 |
Bond prices and yields move in opposite directions
A bond promises fixed payments. The page's bond pays 4 a year for 10 years and 100 at the end. Its price is what those payments are worth today, each one discounted at the market rate: P = 4/(1+i) + 4/(1+i)2 + … + 104/(1+i)10. At 4% the price is exactly 100; at 2% the same payments are worth 117.97; at 6% only 85.28. So "bond prices rise" and "yields fall" are the same event, seen from two sides.
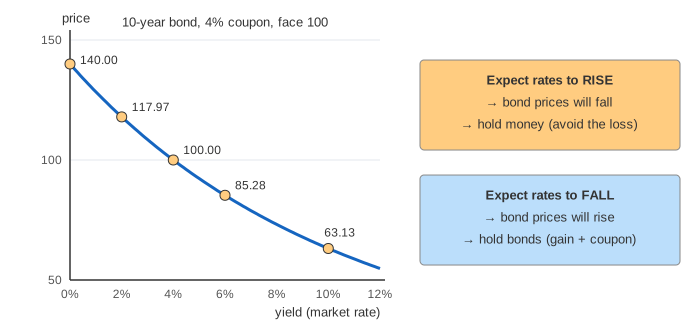
This is the root of Keynes's speculative motive. Someone who expects rates to rise also expects bond prices to fall, and a fall in price can wipe out a year's interest. When rates are already low, more people expect them to go back up, so more people prefer money. That is why the curve gets flatter as the rate falls.
What shifts the curves
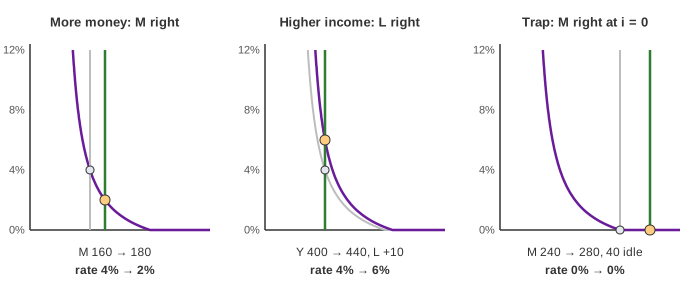
- More money (M right): the rate falls along the demand curve (Demo: buy bonds, the rate falls).
- Higher income (L right): more transactions need more money at every rate. With M fixed, people sell bonds to get it and the rate rises (Demo: income rises, L shifts right).
- Fear (L right): a bigger precautionary buffer, same effect. In a panic everyone wants cash at once and the rate jumps from 4% to 10% unless the central bank supplies the money (Demo: panic, then the central bank supplies money). That is the lender-of-last-resort idea in one picture; see Flight to Quality for where the fleeing money goes.
The liquidity trap and the zero lower bound
At a 0% rate a bond pays nothing more than money, and its price can only fall from there. Nobody gains by swapping money for it, so the money demand curve turns flat at i = 0: people will hold any amount of extra money. A central bank that keeps buying bonds then just piles up idle money, and the rate does not move (Demo: liquidity trap at the zero lower bound: M 240 gives 0%; M 280 still gives 0% with 40 held idle). Keynes described this as a possibility; Japan from the late 1990s and the US, euro area and UK after 2008 came close to it for short-term rates. Central banks then turned to forward guidance (promising to keep rates low) and quantitative easing (buying long-term bonds to push down long yields directly). A few set slightly negative rates, which shows the "zero" floor is really a little below zero, because holding large amounts of cash has its own costs.
How central banks work today
Modern central banks such as the Federal Reserve set a target for a short-term interest rate and supply whatever reserves banks demand at that rate. With ample reserves the Fed steers the rate mainly with the interest it pays on reserves (IORB) and its overnight reverse repo facility, not with daily bond trades. In the page's terms, the central bank picks i and lets M follow money demand: when income rises it adds money so the rate stays at its target (Demo: rate targeting meets an income rise: M 160 → 170 keeps 4%). The liquidity preference diagram still explains why the rate and the quantity of money are tied together. For how the rate change then reaches spending and prices, see Monetary Transmission; for the long-run link between money and prices, Quantity Theory of Money; for where money circulates, Money Circular Flow.
What the page leaves out
One interest rate for everything (no yield curve, term premium or credit spreads), the price level (demand is for nominal money at fixed prices), the goods market and its feedback on income (the IS–LM model joins the two), banks creating deposits by lending (the money multiplier and its limits), expectations that change over time (Keynes's "normal rate" and Tobin's portfolio model), inflation and real versus nominal rates, and the capital gains and losses on the holders' bonds when prices move (wealth is counted at current value and kept at 100 each).