The idea: every dollar lent is a dollar borrowed
Flow-of-funds accounts track how money moves between the big groups of an economy. In the US they are the Fed's Z.1 Financial Accounts, published every quarter. The economy is split into sectors: households, nonfinancial business, government, the financial sector (the Fed, banks, money market funds, pension funds, …) and the rest of the world. For each sector the accounts record what it saved, what it invested, and which financial assets and debts it bought or issued.
The whole system rests on one fact: a financial asset is always someone else's liability. A Treasury bond is an asset to the household that holds it and a debt of the government. So when you add up any instrument across all sectors, you get zero. And when one sector spends more than its income, some other sector must be spending less than its income and lending it the difference.
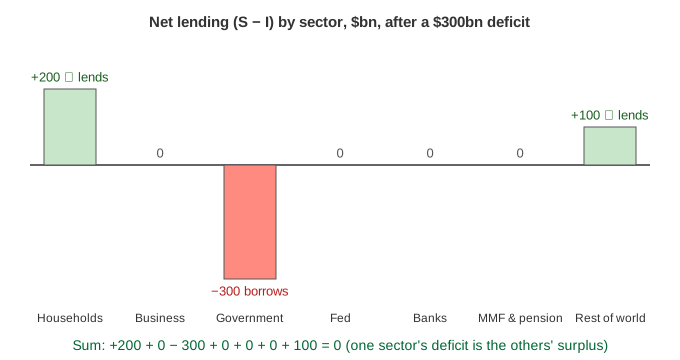
Saving, investment and net lending
For each sector, in one quarter:
- Saving (S) is income not spent on consumption. For the government it is taxes minus spending, so a deficit is negative saving.
- Investment (I) is spending on new real assets: machines, buildings, new houses.
- Net lending = S − I. If it is positive the sector has money left over and lends it out (it buys financial assets or repays debt). If it is negative the sector is a net borrower: it issues debt or sells assets.
Spending by one sector is income of another. So the net-lending row adds up to zero across all sectors, the rest of the world included. This is the sectoral balances identity: private surplus + government surplus + rest-of-world surplus = 0. For the US the rest of the world's surplus is the US current-account deficit.
Each sector box on the canvas shows its S and I for the quarter; the top row of the flow matrix shows S − I.
The transactions matrix: sources and uses
The flow matrix has one column per sector and one row per instrument (deposits, reserves, loans, Treasuries, corporate bonds, equities, fund shares). It uses the sign convention of Godley and Lavoie:
| Sign | Meaning | Examples |
|---|---|---|
| + | a source of funds: money comes in | saving, taking a loan, issuing a bond, selling an asset, running down deposits |
| − | a use of funds: money goes out | investing, lending, buying a bond, adding to deposits, repaying a loan |
Two things then always hold, and the canvas checks them after every step (the Σ cells):
- Every row sums to zero. If households buy $100 of Treasuries (−100), the government issued them (+100).
- Every column sums to zero. A sector's sources equal its uses. Its financial rows add up to minus its net lending: a sector with net lending +100 must have net uses of 100 in financial assets.
Reading the demos
| Demo | What the matrix shows at the end |
|---|---|
| Deficit financed by Treasuries | Net lending: Government −100, Households +100. Treasuries: Government +100, Households −100. The deposits row is back to 0: the cash went round and came back. |
| $300 deficit, three kinds of buyer | Government −300, Households +200, Rest of world +100. Households, banks and foreigners each buy $100 of Treasuries. The bank pays by creating a deposit, so deposits grow by 100. |
| Trade deficit recycled into Treasuries | Households spend the deficit's income on imports; foreigners use the dollars to buy Treasuries. Government −100, Rest of world +100: the "twin deficits". |
| Corporate bond bought by a pension fund | Business invests (−100), households save the income (+100), put it in a pension fund, and the fund buys the firm's bond. The fund sits in the middle: +100 fund shares, −100 bonds. |
| Mortgage, the loan creates the deposit | Loans: Households +200, Banks −200. Deposits: Banks +200 (new money), Business −200 (the builder got paid). Net lending: Households −200, Business +200. |
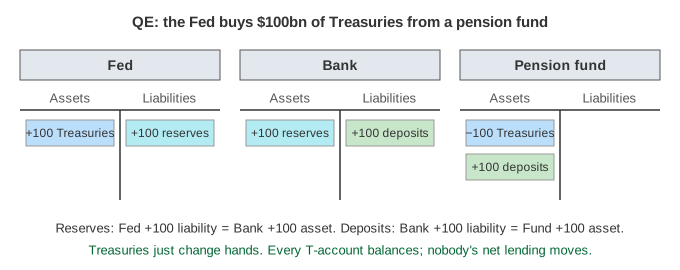
| QE swaps reserves for Treasuries | Net lending all 0. Treasuries move to the Fed (−200), reserves appear (Fed +200, Banks −200), and buying from a fund adds a deposit. |
Government spending lands in households' deposits first, so in the page the deficit comes before the auction. In real life the Treasury keeps a cash balance and auctions on a schedule; the order does not change the end of the quarter.
Stocks and flows
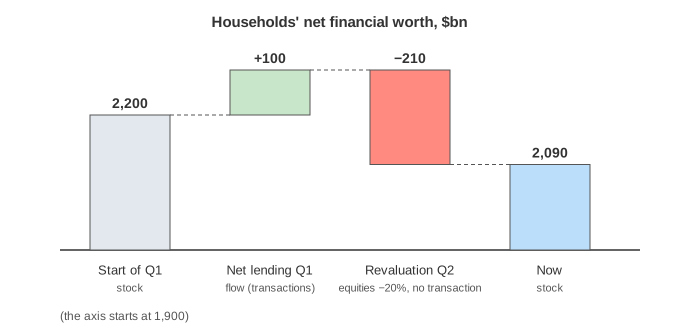
A flow happens during a period: $100 of Treasuries bought this quarter. A stock is what is held at a moment: $1,700 of Treasuries outstanding. The lower matrix is the balance sheet, with + for an asset and − for a liability; its bottom row is each sector's net financial worth.
Every transaction moves both matrices. A use of funds (−100 in the flow matrix) adds +100 to an asset in the balance sheet, so
New Quarter sets the flow matrix back to zero; the balance sheet carries over. A change in prices is a revaluation: it changes the stocks with no transaction at all (Demo: stocks vs flows). When equities fall 20%, households lose $210bn ($110bn on the shares they hold directly, $100bn passed on by their funds) and business's equity liability shrinks by $200bn, while the flow matrix stays at zero. Z.1 records this in separate revaluation tables (the R. tables).
QE in the matrix
In quantitative easing the Fed buys Treasuries and pays with reserves, deposits that banks hold at the Fed. Only banks can hold reserves. If the Fed buys from a bank, the bank swaps one asset (Treasuries) for another (reserves). If it buys from a pension fund, the fund's bank gets the reserves and credits the fund with a new deposit. In both cases nobody's net lending moves: QE changes the mix of assets the private sector holds, not how much it saves.
Where the real numbers are
In Z.1, the F. tables are flows (for example F.100 households, F.103 nonfinancial corporate business, F.106 federal government, F.133 rest of the world), the L. tables are levels (stocks), the R. tables are revaluations and the B. tables are balance sheets. Each instrument also has its own table, such as F.210 for Treasury securities, which lists every sector that issued or bought them, so that row adds to zero. Real tables have a statistical discrepancy row, because the sources measure saving and financial flows separately.
See also money in the circular flow, monetary policy transmission, global dollar liquidity and the credit cycle.
What the page leaves out
Real accounts have many more sectors (nonprofits, state and local government, insurers, broker-dealers, GSEs) and dozens of instruments (currency, trade credit, foreign direct investment, pension entitlements kept apart from fund shares). The Treasury's cash account is at the Fed, so its spending and auctions also move bank reserves; the page keeps it as a plain deposit. Interest, dividends, taxes on income, depreciation and the statistical discrepancy are left out, and every number is a round illustration, not Z.1 data.