The idea: rate = neutral + inflation gap + output gap
A central bank sets one short-term interest rate, the policy rate. In 1993 John Taylor noticed that the US Federal Reserve behaved as if it followed a simple recipe. Start from the rate that neither pushes nor holds back the economy. Add a reaction to how far inflation is from target. Add a reaction to how far output is from its normal level. That recipe is the Taylor rule.
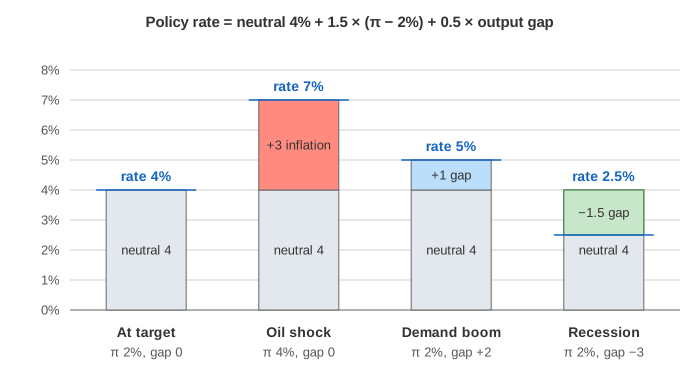
The page uses Taylor's own numbers: i = r* + π* + 1.5 × (π − π*) + 0.5 × output gap, with a neutral real rate r* = 2% and an inflation target π* = 2%. Each quarter the bank reads inflation and the gap, adds the terms and sets the rate. Then the economy reacts, and the next quarter starts.
The three terms
| Term | Value | Meaning |
|---|---|---|
| neutral rate r* + π* | 2% + 2% = 4% | the rate at target inflation and full employment |
| inflation term | 1.5 × (π − 2%) | inflation above target raises the rate |
| output-gap term | 0.5 × gap | a boom raises the rate, a slump lowers it |
The output gap is how far real output is above (+) or below (−) potential output, in percent. Taylor wrote the rule as r* + π + 0.5 × (π − π*) + 0.5 × gap. That is the same thing: π + 0.5 × (π − 2) = 2 + 1.5 × (π − 2).
How the economy reacts
What matters for spending is the real rate r = i − π: the interest rate after inflation. When r is above r* = 2%, policy is tight: borrowing is dear and spending slows, so the output gap falls. When r is below 2%, policy is loose and spending speeds up. A positive gap then pushes inflation up a little each quarter. The page uses two small equations: gap' = 0.8 × gap − 0.5 × (r − r*) and π' = π + 0.4 × gap.
After a demand boom the rule raises the rate to 5%, the real rate goes above 2%, and the gap closes (Demo: demand boom). After a recession it cuts to 2.5% (Demo: recession). Both end near 4% after 12 quarters.
The Taylor principle
The key number is the 1.5 on inflation. If inflation rises one point, the rate rises 1.5 points, so the real rate rises half a point and cools the economy. This is the Taylor principle: react by more than one for one.
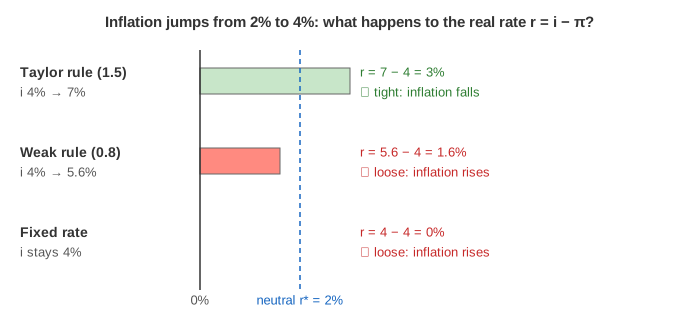
With a weaker reaction of 0.8, the real rate falls when inflation rises. Spending picks up, the gap turns positive and inflation climbs further: 6.2% after 12 quarters (Demo: weak rule). With a fixed 4% rate it is worse, and inflation spirals off the chart (Demo: fixed rate). Many economists read the 1970s this way: the Fed raised rates, but by less than inflation.
The zero lower bound
The rule can ask for a negative rate. After a deep recession with a gap of −5, inflation falls below zero and the rule wants about −1.8%. But people can hold cash at 0%, so the policy rate can't go much below zero. The page floors it at 0%: the zero lower bound. The real rate can't fall as far as the rule wants, so the economy gets less help and inflation stays below zero for the whole 12 quarters (Demo: deep recession). The grey "rule says" line on the chart shows the rate the rule wanted.
See also the IS–LM model, where the central bank moves the LM curve, and supply and demand for how one market finds its price.
How a change in the policy rate then reaches loans, prices and jobs is shown on monetary policy transmission.
What the page leaves out
Real central banks don't follow the rule mechanically. They use forecasts instead of today's numbers, smooth rate changes over many meetings, and argue about r* and the size of the output gap, which can't be measured directly. The page's economy is backward looking: there are no expectations, no exchange rate and no lags in data. At the zero lower bound banks use other tools, such as forward guidance and quantitative easing, which the page doesn't show.