The idea: the price moves until supplied = demanded
In a market, buyers and sellers meet at one price. The demand curve says how much buyers want at each price. The supply curve says how much sellers offer at each price. At most prices the two numbers differ. The one price where they are equal is the equilibrium price P*, and the amount traded there is the equilibrium quantity Q*.
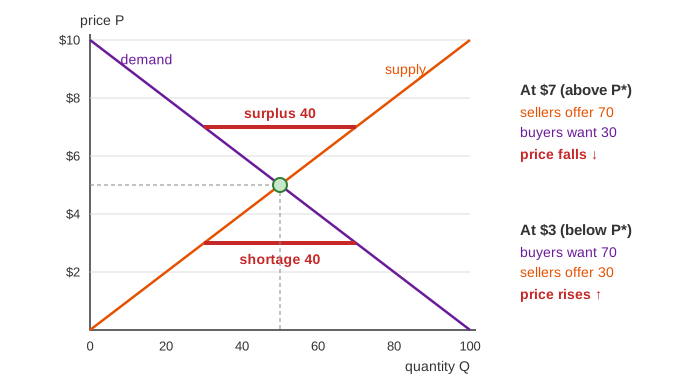
The page uses a coffee-bean market with numbers you can check by hand. Price P is in dollars per kg and quantity Q in tonnes per week. Demand is Qd = 100 − 10·P and supply is Qs = 10·P, so at the start P* = $5 and Q* = 50.
Demand: higher price, fewer buyers
When coffee gets dearer, some buyers drink less, and some switch to tea. So the quantity demanded falls as the price rises, and the demand curve slopes down. This is the law of demand.
Supply: higher price, more sellers
A higher price makes it worth growing more, using older stock, or shipping from farther away. So the quantity supplied rises with the price, and the supply curve slopes up.
Shortage, surplus and the price
If the price is below P*, buyers want more than sellers offer. That is a shortage: buyers outbid each other and sellers raise the price. If the price is above P*, there is a surplus: unsold stock piles up and sellers cut the price. On the page the price moves $0.50 per round toward the crossing. Every round the gap gets smaller, and the price stops moving once Qs = Qd. The "Price by round" chart shows the path.
The quantity actually sold is the smaller of the two: you can't buy what no one offers, and you can't sell what no one wants. So trade = min(Qd, Qs).
Shifting a curve vs moving along it
A change in the price itself moves the market along the curves. A change in anything else shifts a whole curve. Incomes, tastes and the price of tea shift demand. Harvests, costs and technology shift supply. After a shift, the old price no longer clears the market, and the rounds start again.
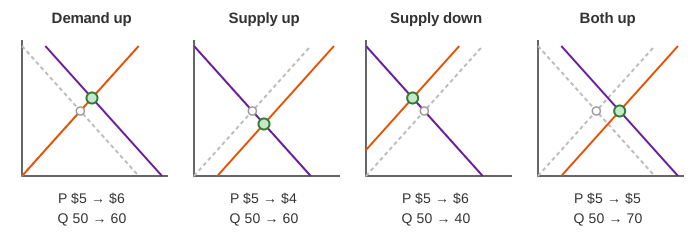
| Change | Curve | New P* | New Q* |
|---|---|---|---|
| Incomes rise (demand +20) | demand right | $6, up | 60, up |
| Big harvest (supply +20) | supply right | $4, down | 60, up |
| Frost (supply −20) | supply left | $6, up | 40, down |
| Both +20 | both right | $5, same | 70, up |
Try Demo: demand rises, Demo: supply rises, Demo: bad harvest and Demo: demand and supply both rise.
Price ceilings and floors
A price ceiling is a legal maximum, like rent control. It matters only when it is below P*. Then the price can't rise to clear the shortage, and the shortage stays: at a $4 ceiling buyers want 60 but sellers offer 40, so only 40 tonnes are sold (Demo: price ceiling $4). A price floor is a legal minimum, like a minimum wage or a farm price support. It matters only above P*. At a $7 floor sellers offer 70 but buyers want 30, a surplus of 40 (Demo: price floor $7). A ceiling above P* or a floor below it does nothing.
What the page leaves out
Real curves are not straight lines, and real prices don't move by a fixed $0.50 per round. Some prices change quickly (auctions, stock exchanges) and some are sticky for months. The page doesn't show consumer and producer surplus, deadweight loss, elasticity, taxes, or markets with few sellers (monopoly, oligopoly). It also has one market alone: in a real economy the price of coffee shifts the demand for tea, and that feeds back.
See where this page fits on the Economics & Money mind map.