The idea: the rate moves until both deposits pay the same
An investor with dollars can keep them in a dollar deposit, or change them into euros, keep a euro deposit, and change back in a year. If one way pays more, money flows into it. That flow buys one currency and sells the other, so it moves the exchange rate. The flow stops only when both ways pay the same. This is interest parity.
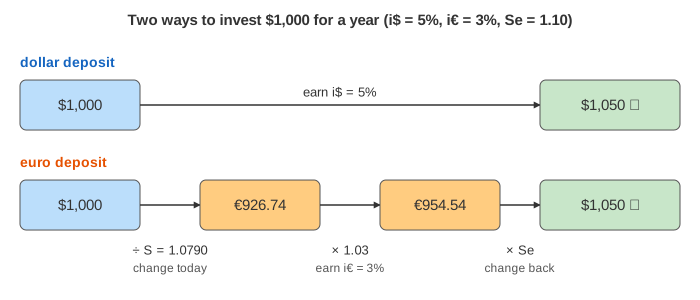
The page uses the dollar and the euro with numbers you can check by hand. Both deposits start at 3% a year. A basket of goods costs $110 in the US and €100 in the euro area, so the rate people expect in a year is 1.10 dollars per euro, and the spot rate starts there.
The exchange rate is a price
The page quotes S in dollars per euro, as currency markets quote EUR/USD. S = 1.10 means one euro costs $1.10. When S rises the euro gets dearer: the euro is stronger and the dollar is weaker. When S falls the dollar is stronger. Like any price, S moves when more people want to buy one side than the other (see Supply and Demand).
Uncovered interest parity
A dollar deposit pays i$. A euro deposit pays i€ in euros, but in dollars it also gains or loses with the euro. If you expect the rate Se in a year, the euro deposit pays, in dollars:
R€ = (1 + i€) · Se / S − 1
On the chart, the blue vertical line is i$ and the orange curve is R€. The curve slopes down: the dearer the euro is today, the less room it has to gain by next year. Where the two cross, R€ = i$, and that gives the parity rate:
S* = Se · (1 + i€) / (1 + i$)
When the Fed raises i$ from 3% to 5%, dollar deposits pay more. Investors sell euros and buy dollars, and S falls round by round, 1.10 → 1.09 → 1.08 → 1.0790. At 1.0790 the euro is cheap enough that it is expected to gain about 1.94% by next year, which tops its 3% up to 5% (Demo: Fed raises 3% → 5%). So a rate hike makes a currency stronger today, while people still expect the same rate next year. A cut does the opposite (Demo: Fed cuts 3% → 1%).
| Change | Who pays more at the old S | Flow | New S |
|---|---|---|---|
| Fed 3% → 5% | dollar deposit | into dollars | 1.0790, dollar up |
| ECB 3% → 5% | euro deposit | into euros | 1.1214, euro up |
| Fed 3% → 1% | euro deposit | into euros | 1.1218, dollar down |
| both +2 points | neither, in the end | none | 1.1000, no change |
Only the gap matters
S* depends on the ratio (1 + i€) / (1 + i$). If both central banks raise rates by the same amount, the ratio barely changes and the rate goes back where it was (Demo: both raise by 2 points). Markets watch the rate differential, not either rate alone.
Purchasing power parity sets the expected rate
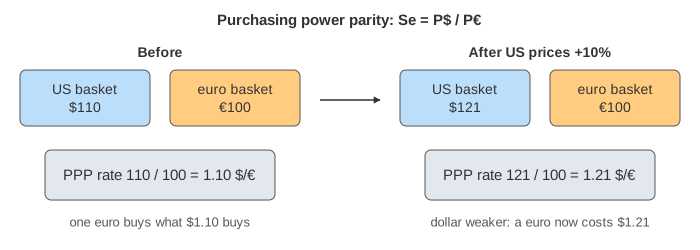
Where does Se come from? In the long run, a euro should buy the same basket as its price in dollars. This is purchasing power parity (PPP): Se = P$ / P€. If US prices rise 10%, the basket costs $121 and the PPP rate becomes 1.21. People now expect a weaker dollar, so euro deposits pay far more in dollars, money rushes into euros, and S jumps to 1.21 right away: 1.10 → 1.15 → 1.18 → 1.20 → 1.21 (Demo: US inflation 10%). The currency moves before most prices have.
Covered parity and the forward rate
A bank will sell you euros for delivery in a year at a fixed forward rate F. With F you can lock in the euro deposit's dollar return with no risk. Arbitrage keeps that locked return equal to i$, so covered interest parity holds: F = S · (1 + i$) / (1 + i€). The table shows F every round. When uncovered parity holds too, F = Se: the forward rate is the market's forecast.
How dollar funding moves around the world, and why it matters for exchange rates, is on global dollar liquidity.
What the page leaves out
Real investors want a risk premium to hold a riskier currency, so UIP fails in the data for months or years; the carry trade earns money by betting that it does. PPP holds only over many years, and not for goods that can't be shipped. The page doesn't show overshooting (Dornbusch), capital controls, central-bank intervention, trade flows, or how a weaker currency feeds back into inflation. The rate here moves in rounds; real FX markets reprice in milliseconds.