The idea: slice the surface at equal heights
A function of two variables, z = f(x, y), gives a height for every point (x, y). Drawn in 3D it is a surface. Cut it with the horizontal plane z = k: the cut is every point of the surface at height exactly k. Look at that cut from above and you get a curve in the x-y plane, the level curve
f(x, y) = k
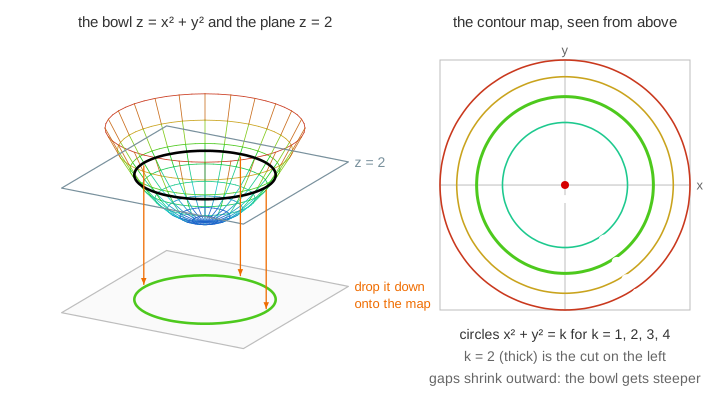
Do this for evenly spaced heights k = 0, 1, 2, … and draw all the curves on one picture: that is a contour map. It shows a 3D shape on flat paper. The page colours each curve with the same height colour as the surface: blue low, red high.
Building a contour map
Each level takes three steps on the canvas: the plane rises to z = k, the cut appears on the surface, then the cut drops onto the map and stays. For the bowl z = x2 + y2 the level curve x2 + y2 = k is a circle of radius √k, and k = 0 is just the point at the bottom. (Demo 1: sweep the plane up through the bowl)
Two curves of different heights never cross: a point (x, y) has only one height. The one exception looks like a crossing but is a single curve meeting itself, at a saddle (below).
Close lines = steep
Neighbouring curves differ by the same height step Δk. Walk from one to the next: you climb Δk over the distance between them, so the slope is about Δk / gap. Close lines mean steep, wide gaps mean gentle.
- Bowl: radii 1, 1.41, 1.73, 2 for k = 1, 2, 3, 4. The gaps shrink (0.41, 0.32, 0.27) because the bowl gets steeper going out.
- Hill 3e−(x2 + y2)/2: along the x-axis the curves k = 3, 2.5, …, 0.5 sit at 0, 0.60, 0.90, 1.18, 1.48, 1.89. The smallest gap (0.28) is around r = 1, the steepest part of the hill; the flat top and the flat foot have wide gaps. (Demo 2: spacing shows steepness)
The steepest way up crosses the curves at right angles: the gradient ∇f is perpendicular to the level curve and its length is the slope. This is what Gradient Descent follows downhill on a loss surface's contour map.
A point is a top or bottom, a crossing is a pass
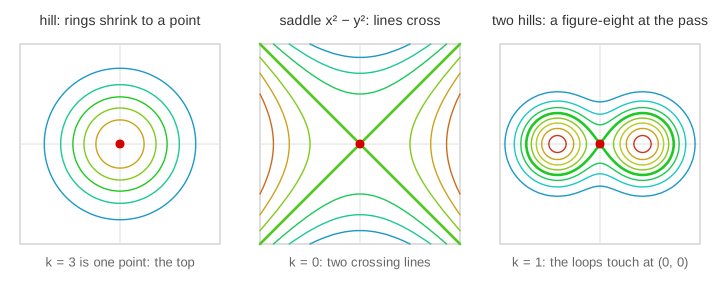
- A single point. Near a top (or bottom) the level curves are small closed loops that shrink to one point at the top's height. For the hill, k = 3 is only the point (0, 0): the maximum. For the bowl, k = 0 is the minimum.
- Crossing lines. For the saddle z = x2 − y2, levels k > 0 are hyperbolas opening left and right, k < 0 hyperbolas opening up and down, and k = 0 is the two lines y = ±x crossing at the saddle point (0, 0): uphill along x, downhill along y. (Demo 3: saddle: the crossing level) More on this surface: Hyperbolic Paraboloid.
- Two hills and a pass. f = 2.11(e−((x − 1.2)2 + y2) + e−((x + 1.2)2 + y2)) has two bumps at x = ±1.2; the factor 2.11 ≈ e1.44/2 puts the pass at (0, 0) at height exactly 1. Low levels are one curve around both hills. At the height of the pass (k = 1) the curve pinches into a figure-eight that touches itself at the pass. Higher up there are two loops, one per top. (Demo 4: two hills and the pass)
A plane: straight, parallel, evenly spaced
For z = x + y the level curve x + y = k is a straight line. All the lines are parallel and the same distance apart (1/√2 for Δk = 1): the plane has the same slope everywhere, in the direction (1, 1) at right angles to the lines. (Demo 5: plane: straight parallel lines)
The six functions
| function | level curves f = k | what to notice |
|---|---|---|
| bowl x2 + y2 | circles r = √k; k = 0 a point | gaps shrink outward: steeper |
| elliptic bowl x2/4 + y2 | ellipses 2√k by √k | wide gaps along x, close along y |
| saddle x2 − y2 | hyperbolas; k = 0 two crossing lines | crossing = saddle point |
| plane x + y | parallel lines x + y = k | equal gaps: one slope |
| hill 3e−(x2 + y2)/2 | circles; k = 3 a point | closest gaps near r = 1 |
| two hills | one loop, a figure-eight at k = 1, two loops | the pass is a saddle |
The bowls and the saddle are quadric surfaces: Elliptic Paraboloid and Quadric Surfaces show the same cuts z = h as traces.
Topographic maps
A hiking map is a contour map of the ground: f(x, y) is the altitude. The step between lines is the contour interval (often 10 or 20 m), and every fifth line is drawn thicker with its height written on it. Rings closing around a summit, crowded lines on a cliff, a figure-eight-like pinch at a pass: the same three features as on this page. Weather maps use the same idea with pressure (isobars) or temperature (isotherms) instead of height.
How the curves are computed
For a general f there is no formula for the curve, so the page finds it numerically with marching squares: work out f on a 48 × 48 grid of small squares; in each square, look at which corners are above k and which below; the curve must cross every edge whose two corners disagree, at the point found by linear interpolation. The little pieces are chained into whole curves, spaced out evenly, and each point is nudged onto f = k exactly with a few Newton steps. A square whose opposite corners are above k is ambiguous; the value at its centre decides how to connect.
See also Quadric Surfaces, Elliptic Paraboloid, Hyperbolic Paraboloid and Gradient Descent.
Why the level through a saddle crosses itself, with the second-derivative test and the node, cusp and isolated point of a curve: critical and singular points.
The level curves of x³ − 3xy² are cubic curves with three branches, see Monkey Saddle, and the cuts of x³ + y³ + z² = 1 share the asymptote x + y = 0, see Cubic Surface.
What the page leaves out
Level surfaces f(x, y, z) = k of functions of three variables, the exact link between the gradient and the spacing (the directional derivative), contour maps with uneven intervals, shaded relief, and the 3D version of marching squares (marching cubes).