The idea: one threshold, one point
A classifier gives every example a score. A threshold t turns scores into decisions: score ≥ t means flagged (predicted positive). That fills a confusion matrix (TP, FP, FN, TN), and from it two rates: the true positive rate TPR = TP / (TP + FN), the share of positives caught, and the false positive rate FPR = FP / (FP + TN), the share of negatives raised as false alarms. One threshold gives one point (FPR, TPR). Every threshold together gives the ROC curve (receiver operating characteristic).
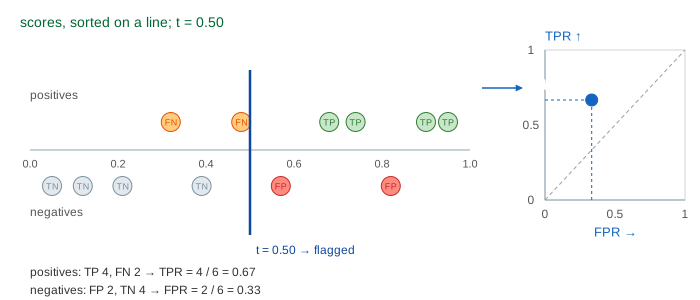
TPR and FPR
TPR is the same number as recall. FPR is new: it divides the false alarms by all real negatives, not by what was flagged. That is the difference from precision = TP / (TP + FP), which divides by what was flagged. The Precision vs Recall page covers precision, recall, F1 and the PR curve on their own. Here both curves are drawn side by side.
Sweeping the threshold: up for a positive, right for a negative
Sort the examples by score. Lowering t past one example flags exactly that example. If it is a positive, TP grows by one and the point moves up by 1/P (P = number of positives). If it is a negative, FP grows by one and the point moves right by 1/N. So the ROC curve of a finite set is a staircase from (0, 0), nothing flagged, to (1, 1), everything flagged. (Demo: lower t one example at a time: 7 Steps, 5 up and 2 right, end at FPR 0.33, TPR 0.83.) A good model ranks positives first, so its staircase climbs before it goes right and hugs the top left corner. (Demo: sweep t, the whole ROC curve)
AUC: the chance a positive outranks a negative
The AUC is the area under the ROC curve. Cut the ROC square into a P × N grid: one row per positive, one column per negative. A row's part under the staircase starts where that positive is flagged, which is after every negative scored above it. So the cells under the curve are exactly the (positive, negative) pairs in which the positive has the higher score:
AUC = (pairs where the positive scores higher) / (P · N) = the probability that a randomly picked positive scores above a randomly picked negative. This is the Mann-Whitney U statistic divided by P · N. In the balanced data the six positives beat 6, 6, 5, 5, 4 and 3 negatives: 29 of 36 pairs, AUC = 0.81. (Demo: AUC = count the pairs)
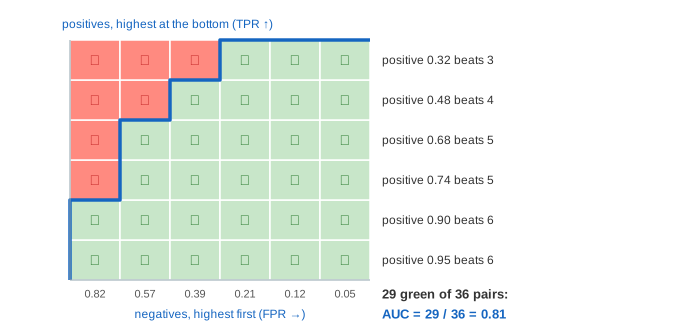
AUC only looks at the order of the scores, never at their values or at any threshold. Doubling every score, or squashing them through a sigmoid as logistic regression does, leaves it unchanged.
Guessing, perfect, and below 0.5
A model whose scores carry no information wins about half the pairs: its staircase wanders around the diagonal and AUC ≈ 0.50. (Demo: a model that guesses: 18 of 36 pairs, exactly 0.50.) A perfect ranking puts every positive above every negative: straight up to (0, 1), then right, AUC = 1. An AUC below 0.5 means the ranking is mostly backwards; flipping the sign of the score would make it useful.
Heavy imbalance: the ROC stays, the PR curve falls
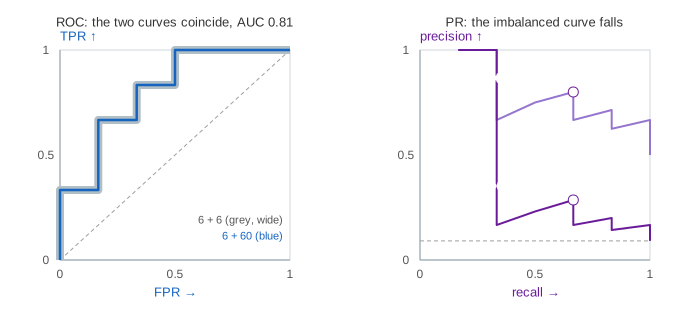
TPR divides only by positives and FPR only by negatives, so neither depends on how many of each there are. Give the same model ten times as many negatives with the same place in the ranking (6 positives, 60 negatives) and the ROC curve does not move: every step right is now 10 columns of 1/60 instead of one of 1/6. AUC stays 0.81. Precision mixes the two classes, so it falls: at t = 0.68 the model flags 4 positives and 1 negative in the balanced data (precision 0.80) but 4 positives and 10 negatives here (precision 4/14 = 0.29). Average precision, the area under the PR curve, falls from 0.82 to 0.48, and a guessing model's precision is the base rate 6/66 = 0.09. (Demo: heavy imbalance, same ROC, worse PR)
Which curve to report
| situation | look at | why |
|---|---|---|
| classes roughly balanced, ranking quality | ROC, AUC | one number, independent of the threshold and the class ratio |
| positives rare (fraud, disease, defects) | PR curve, average precision | shows how many false alarms come with each catch |
| the class ratio will change in production | ROC | TPR and FPR stay the same; precision would not |
| a fixed alert budget (top 100 per day) | precision at k | only the top of the ranking matters |
| picking the operating threshold | both, plus costs | AUC says how well it ranks, not where to cut |
See also Precision vs Recall for F1 and accuracy on imbalanced data, Logistic Regression, whose predicted probability is the kind of score thresholded here, and Bayes' Theorem, where precision is P(positive | flagged).
What the page leaves out
The datasets have no tied scores. A tie between a positive and a negative makes a diagonal step on the ROC curve and counts as half a pair. The page also leaves out confidence intervals for AUC, ROC for more than two classes (one-vs-rest, macro and micro averaging), partial AUC over a low-FPR range, calibration (AUC ignores whether a score of 0.8 means 80%), the interpolated PR curve, cost curves, and choosing the threshold on a validation set rather than the test set.