The idea: K centres, each point joins the nearest one
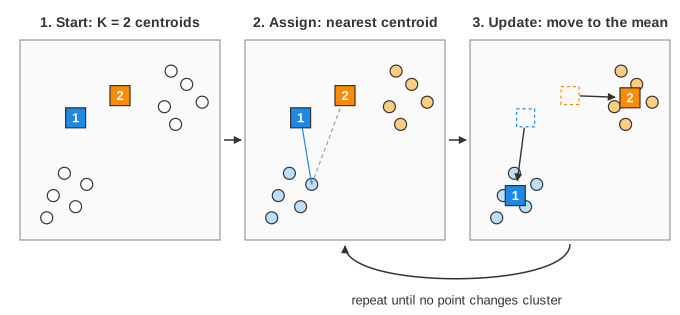
K-Means splits points into K groups (clusters) without any labels. Each cluster has a centre, the centroid. The algorithm (Lloyd's algorithm) repeats two steps: assign every point to its nearest centroid, then update every centroid to the mean of its points. When an assignment step changes no point, it stops.
The page uses 30 fixed points in three blobs. Points take the colour of their centroid (the numbered squares). The panel on the right lists each centroid, and the bar chart shows the SSE after each iteration.
The assignment step
For every point, compute the distance to every centroid and pick the smallest. The first time, the page draws the distances from one point (the one where the choice is closest) so you can check the rule. With K centroids and n points this costs n·K distance computations per iteration.
The update step
Each centroid moves to the mean of its points: the average x and the average y. The ring shows where it will go before it moves. If a centroid has no points left (an empty cluster), the page leaves it where it is.
SSE (inertia) and why it stops
K-Means minimizes the SSE, also called inertia: the sum, over all points, of the squared distance to their own centroid, SSE = Σ ‖x − μc(x)‖².
- The assignment step can only lower it: each point moves to a centroid that is at least as close.
- The update step can only lower it: for a fixed group of points, the mean is the point with the smallest sum of squared distances.
There are finitely many ways to split 30 points, and the SSE never goes up, so the loop always ends. On the clean run the SSE goes 90.08 → 80.84 → 71.60 → 65.19, then nothing changes. (Demo 1: clean run)
Local optima: a bad start stays bad
"Can only go down" also means K-Means never climbs out of a bad answer. If two centroids start in the same blob and the third sits between the other two blobs, the first two share one blob and the third takes two blobs. Every point is already at its nearest centroid, so the loop stops at SSE 145.94, more than twice the best 65.19. (Demo 2: bad init) Of all 4060 ways to start on 3 of the 30 points, 64 (1.6%) end in a worse local optimum.
Initialization: random points vs k-means++
| Init | How the starting centroids are chosen | Effect |
|---|---|---|
| Forgy (random points) | K data points picked at random | simple; two picks in one blob can get stuck |
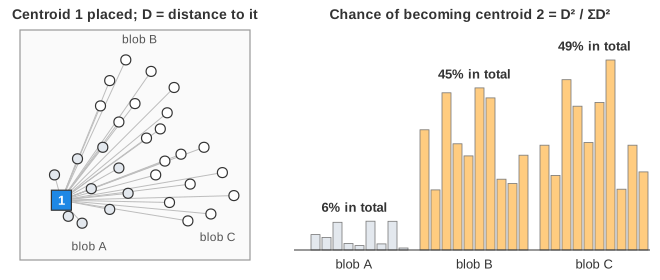
| k-means++ | first one at random, each next one with probability D(x)² / ΣD² | centroids spread out; fewer iterations, rarely stuck |
restarts (n_init = 10) | run 10 times, keep the lowest SSE | cheap insurance against a bad run |
D(x) is the distance from a point to its nearest centroid chosen so far. A point far from every centroid has a large D², so it is likely to be picked; a point next to a centroid has almost no chance. The panel's green line is the best SSE of 10 k-means++ restarts for the current K. In Demo 5 the three picks land in three different blobs and the run converges in 3 iterations (75.75 → 71.56 → 65.19). (Demo 5: k-means++)
Choosing K: the elbow
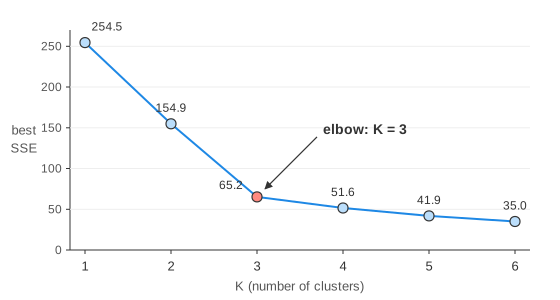
K is an input. With K = 2 two real blobs are merged; with K = 5 real blobs are split into pieces. (Demo 3: K too small ends at SSE 154.88, Demo 4: K too large at 41.90.) The SSE always drops when K grows (with K = 30 it is 0), so "lowest SSE" cannot choose K. Plot the best SSE against K and look for the elbow, where adding a cluster stops paying off:
| K | 1 | 2 | 3 | 4 | 5 | 6 |
|---|---|---|---|---|---|---|
| best SSE | 254.5 | 154.9 | 65.2 | 51.6 | 41.9 | 35.0 |
The silhouette score is another common check: it compares each point's distance to its own cluster with its distance to the next-nearest cluster.
What K-Means assumes
- Clusters are round blobs of similar size: it uses straight-line (Euclidean) distance to one centre. Long, curved or nested clusters need another method (DBSCAN, Gaussian mixtures, spectral clustering).
- Features are on similar scales. If one feature is in metres and another in millimetres, the second decides every distance; standardize the features first. The same issue appears in k-nearest neighbours.
- Outliers pull a mean a long way; K-Medoids uses real data points as centres instead.
K-Means is a form of coordinate descent on the SSE: each step minimizes over one set of variables (assignments, then centroids) with the other fixed. Compare gradient descent, which also only goes downhill and can also stop in a local minimum.
Before clustering high-dimensional data, PCA often projects it onto its few main directions.
See also Supervised vs Unsupervised vs Reinforcement Learning: the same points with labels, without labels, and with rewards, side by side.
To look at clusters in high-dimensional data before running K-Means, see PCA vs t-SNE.
What the page leaves out
The data is 2-D, with 30 points and K up to 6, so every distance can be drawn. Real data has many dimensions
and millions of points, where mini-batch K-Means, Elkan's triangle-inequality speed-up and approximate nearest
centroid search matter. An empty cluster keeps its centroid here; scikit-learn moves it to a far-away point.
The convergence tolerance (tol), the silhouette score and other clustering methods are only described.