The idea: a derivative is the part of the change that is proportional to dx
Grow the input x by a small amount dx and look at how much the output changes, Δf. Draw that change as a picture. Some pieces of it are proportional to dx; others are products of two small numbers, like dx·dx. Divide by dx and let dx shrink: the first kind gives the derivative, the second kind vanishes. Each rule below is one picture.
The power rule: square and cube
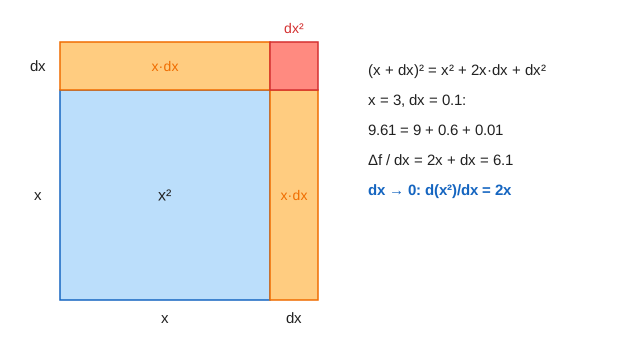
A square of side x = 3 has area 9. With dx = 0.1 the new area is 3.1² = 9.61, so Δf = 0.61. The picture splits it: two strips 3 × 0.1 = 0.3 each and a corner 0.1 × 0.1 = 0.01, so 0.61 = 0.6 + 0.01. Divided by dx: Δf / dx = 2x + dx = 6.1. As dx shrinks the corner's share, dx, goes to 0 and the slope is 2x = 6. (Demo: power rule, x² at 3)
| dx | Δf = (3 + dx)² − 9 | strips 2·3·dx | corner dx² | Δf / dx |
|---|---|---|---|---|
| 0.5 | 3.25 | 3 | 0.25 | 6.5 |
| 0.1 | 0.61 | 0.6 | 0.01 | 6.1 |
| 0.01 | 0.0601 | 0.06 | 0.0001 | 6.01 |
| 0.001 | 0.006001 | 0.006 | 0.000001 | 6.001 |
A cube of side x grows by three slabs x·x·dx (right, top and front), three thin rods x·dx² along the edges between them, and a corner dx³. At x = 3, dx = 0.1: 3.1³ − 27 = 2.791 = 2.7 + 0.09 + 0.001. Only the slabs are proportional to dx, so d(x³)/dx = 3x². The pattern goes on: (x + dx)ⁿ has n copies of xⁿ⁻¹·dx plus pieces with dx² or smaller, which gives the power rule d(xⁿ)/dx = n·xⁿ⁻¹. (Demo: power rule in 3-D)
The product rule: a rectangle u·v
Let u and v be two quantities that depend on x, and draw the product u·v as a rectangle u wide and v high. When x grows, u grows by du and v by dv. The new area adds a strip v·du on the right, a strip u·dv on top, and a corner du·dv. The corner is a product of two small changes, so it vanishes after dividing by dx, and
(u·v)′ = u′·v + u·v′
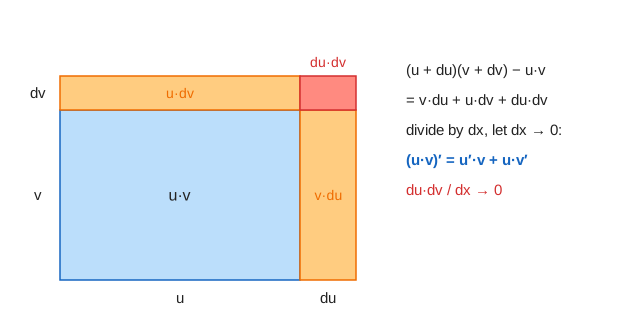
On the canvas u = 2x − 2 and v = x, at x = 3 (u = 4, v = 3). With dx = 0.1, du = 0.2 and dv = 0.1: Δ(uv) = 4.2 × 3.1 − 12 = 1.02 = 0.6 + 0.4 + 0.02. Divided by dx: 6 + 4 + 0.2, heading for u′v + uv′ = 2·3 + 4·1 = 10. (Demo: product rule) The chain rule page shows the same rule as two paths in a computation graph whose gradients add.
sin′ = cos on the unit circle
Put P on a circle of radius 1 at angle θ. Its height is sin θ and its x is cos θ. Step a small angle dθ along the circle to Q. On a radius-1 circle the arc length equals the angle, and for small dθ the arc is almost the straight chord PQ. The chord is perpendicular to the radius OP, so the small triangle under it (sides: chord, a horizontal leg, a vertical leg) is the big triangle O, (cos θ, 0), P turned by 90°. Similar triangles: the vertical leg is to dθ as cos θ is to 1. So the rise is Δ sin ≈ cos θ · dθ, and (sin θ)′ = cos θ.
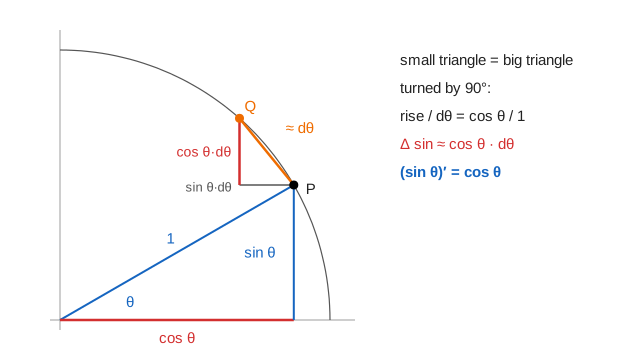
At θ = 30° with dθ = 0.1: Δ sin = 0.08396 while cos θ · dθ = 0.0866. The ratio Δ sin / dθ is 0.840, then 0.8635 at dθ = 0.01, then 0.8658 at 0.001: it closes in on cos 30° = 0.866. The same picture read sideways gives (cos θ)′ = −sin θ: the horizontal leg is sin θ·dθ, and x goes down. (Demo: sin′ = cos)
1/x: a rectangle that keeps area 1
A rectangle x wide and 1/x high always has area 1. Make it wider by dx and it must get lower. The strip gained on the right, dx · 1/(x + dx), must equal the strip lost on top, x · |Δ(1/x)|. So |Δ(1/x)| = dx / (x(x + dx)), and dividing by dx gives (1/x)′ = −1/x², negative because the height falls. At x = 1: −0.667, −0.909, −0.990, −0.999 for the four values of dx. (Demo: 1/x with a rectangle of area 1)
Why the corner can be dropped
The corner is not zero; it is just small compared with dx. Its share of Δf / dx is dx itself for the square and du·dv / dx for the product, so it falls 10 times each time dx falls 10 times, while the strips' share stays the same. That is the column "leftover / dx" on the canvas. The precise version of "shrink dx" is the limit of the difference quotient, animated on the derivative as a limit. The strips are exactly the local linear approximation: near x, f(x + dx) ≈ f(x) + f′(x)·dx.
See also Limits, reading f′ from the graph of f, the Mean Value Theorem, Taylor series (the leftover pieces are the higher-order terms) and the Fundamental Theorem of Calculus, where a thin strip f(x)·dx is again the whole story.
What the page leaves out
The pictures use one concrete point per rule and a fixed ladder of dx values; they show why each rule holds, not a proof with limits. The quotient rule, the chain rule (see its own page), eˣ and ln x, negative or fractional powers (beyond 1/x) and higher derivatives are not drawn. The cube is an oblique sketch, not a true 3-D view.