The idea: three graphs, one x
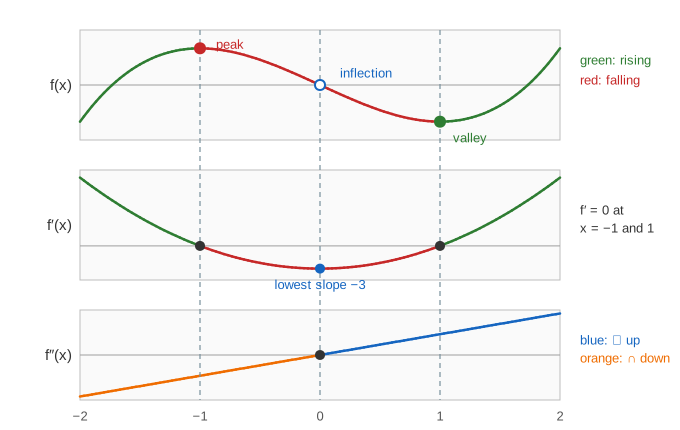
The derivative f′ is a function in its own right: at every x it gives the slope of f. Its own slope is the second derivative f″. Stack the three graphs on one x axis and they answer each other: the sign of f′ says whether f goes up or down, and the sign of f″ says which way f bends. The page draws f, f′ and f″ on top of each other with one cursor line through all three.
f′ says rising or falling
If f′(x) > 0 the tangent points up, so f rises; if f′(x) < 0, f falls. The page colours both graphs the same way: green where f′ > 0, red where f′ < 0. The colour can only change where f′ = 0. Those x are the critical points. If f′ changes from + to −, f has a peak (local max); from − to +, a valley (local min). (Demo: x⁴/4 − x², rising/falling then concavity)
The second-derivative test reads the same answer from f″: at a critical point, f″ < 0 means a max and f″ > 0 a min. For x³ − 3x: f″(−1) = −6, a max; f″(1) = 6, a min.
| f′ | f″ | shape of f |
|---|---|---|
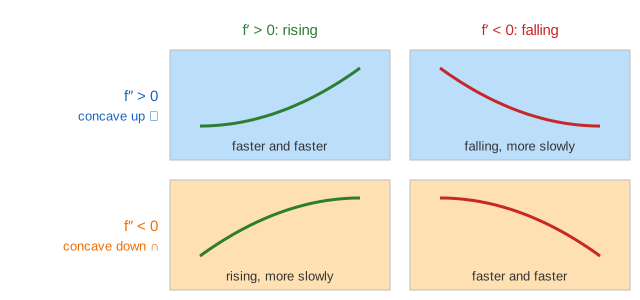
| > 0 | > 0 | rising faster and faster |
| > 0 | < 0 | still rising, but more slowly |
| < 0 | > 0 | still falling, but more slowly |
| < 0 | < 0 | falling faster and faster |
| = 0, + to − | usually < 0 | peak (local max) |
| = 0, − to + | usually > 0 | valley (local min) |
f″ says which way f bends
f″ is the slope of f′. Where f″ > 0, f′ is increasing: the tangent turns left and f is concave up (∪, it would hold water). Where f″ < 0, f′ is decreasing and f is concave down (∩). A point where f″ changes sign is an inflection point. There f is steepest (or least steep), so f′ has a peak or a valley. (Demo: x³ − 3x, sweep x)
Two traps. f′ = 0 is not always a peak: x³ has f′(0) = 0 but keeps rising, because f′ does not change sign. And f″ = 0 is not always an inflection: x⁴ has f″(0) = 0 but is concave up on both sides. What counts is the sign change.
Motion: position, velocity, acceleration
For a moving car, f is the position s(t), f′ is the velocity v(t) = s′(t) and f″ is the acceleration a(t) = v′(t) = s″(t). The page drives a car with s(t) = 1.5t² − t³/6 metres for 8 seconds, so v(t) = 3t − t²/2 and a(t) = 3 − t. The road strip shows s, the speedometer shows v. (Demo: the car)
| t (s) | v | a | what the car does |
|---|---|---|---|
| 0 to 3 | > 0 | > 0 | moves forward and speeds up |
| 3 | 4.5 m/s | 0 | top speed: s has an inflection |
| 3 to 6 | > 0 | < 0 | still forward, braking |
| 6 | 0 | −3 | stops at s = 18 m and turns around |
| 6 to 8 | < 0 | < 0 | backs up faster and faster (v = −8 m/s at t = 8) |
Speeding up means v and a have the same sign, not that a > 0: from t = 6 to 8 the acceleration is negative and the car still gets faster, backwards.
Sketching f′ from f
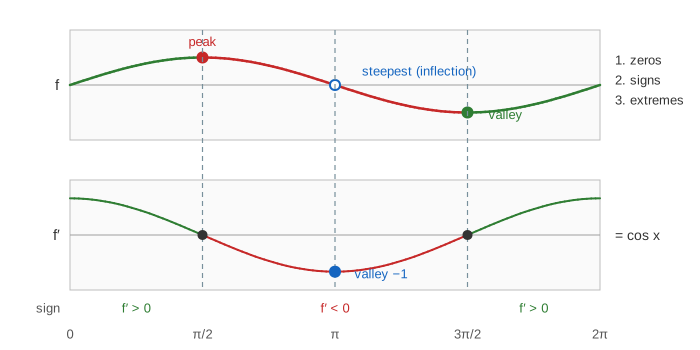
You can draw f′ without a formula, one feature at a time (Demo: sketch f′ from f):
- Every peak or valley of f is a flat tangent: mark a zero of f′ at that x.
- Between the zeros, f rises or falls: f′ is above or below the axis there.
- Every inflection of f is where f is steepest: f′ has its peak or valley at that x.
- Join the marks smoothly.
Going the other way, from f′ back to f, is integration: see Accumulation and the Fundamental Theorem of Calculus. Where f′ itself comes from is on the Derivative as a Limit page, and Local Linearity zooms in until f looks like its tangent. Derivative Rules gives the formulas used here, and the Mean Value Theorem proves that f′ > 0 on an interval really means f rises there. Newton's method finds the zeros of f′ (the critical points) numerically.
Critical points where f′ does not exist (corners, cusps, vertical tangents), critical points of f(x, y) and singular points of curves are on critical and singular points.
What the page leaves out
Only four smooth functions are drawn, with derivatives taken from their formulas. Global maxima on a closed interval (checking the endpoints), corners and cusps where f′ does not exist, vertical tangents, asymptotes, and the first-derivative test for points where f″ = 0 too are described or not covered. The car moves on a straight line only.