The idea: rate × time = amount
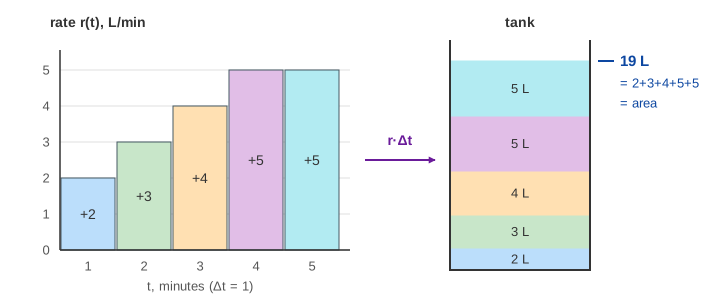
A tap fills a tank at a rate r, in litres per minute. If the rate stays the same for Δt minutes, the tank gains r·Δt litres. On a graph of r against time, r·Δt is the area of a strip of height r and width Δt. Add up the strips and you get the whole amount: the water in the tank is the area under the rate graph. This adding up of a rate over time is called accumulation, and it is what an integral means.
Ticks and strips
The canvas steps time forward in ticks of Δt = 1 minute. During one tick the tap is set to one rate, so the amount added is exactly r·Δt. Each tick draws a coloured strip under the rate graph and drops a layer of the same colour into the tank. The info panel keeps the running sum, and it always equals the water in the tank.
| minute | 1 | 2 | 3 | 4 | 5 | 6 | 7 | 8 | 9 | 10 |
|---|---|---|---|---|---|---|---|---|---|---|
| rate r (L/min) | 2 | 3 | 4 | 5 | 5 | 4 | 3 | 2 | 1 | 1 |
| water so far (L) | 2 | 5 | 9 | 14 | 19 | 23 | 26 | 28 | 29 | 30 |
After 10 minutes the tank holds 30 L, the total area under r(t). The level rises fastest where r is highest, and the rise slows down as r drops, but it never goes down while r ≥ 0. (Demo: fill a tank, water = area under r(t))
If the tank already held some water, that start is simply added: amount at t = start + area under r from 0 to t.
Negative rates: signed area
Open a drain and the rate is negative: r = −4 L/min means the tank loses 4 L each minute. Then r·Δt is negative and the strip hangs below the axis. Area below the axis counts as negative; it removes water. In the second scenario the tank starts with 10 L, gains 4 + 5 + 6 + 5 + 3 = 23 L in the first five minutes (33 L), then loses 2 + 4 + 5 + 3 = 14 L. It ends with 10 + 23 − 14 = 19 L. The signed area is +9. (Demo: fill then drain, signed area; Demo: one draining tick up close)
The highest level is at t = 5, where the rate changes from positive to zero to negative. That is a general rule: the amount peaks where the rate crosses from + to −.
Velocity: displacement and distance
Velocity is the rate of change of position, in metres per second. The same rule applies: the area under v(t) is the change in position. A car with velocities 3, 4, 5, 4, 2, 0, −2, −4, −3, −1 m/s drives forward 18 m and then backs up 10 m. Two different numbers come out of the same graph:
| quantity | what it adds | value |
|---|---|---|
| net displacement | ∫ v dt, strips below the axis count − | 18 − 10 = 8 m |
| total distance (odometer) | ∫ |v| dt, every strip counts + | 18 + 10 = 28 m |
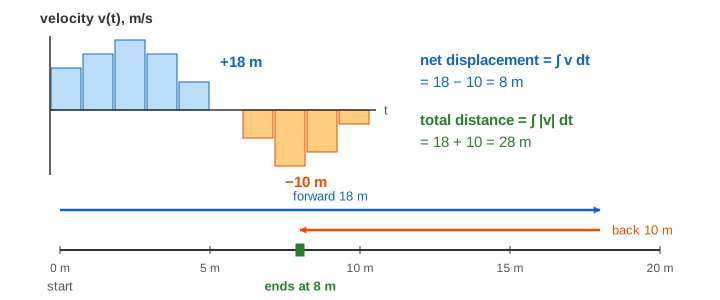
The two are equal only when the car never turns back. Flipping the negative strips above the axis turns the graph of v into the graph of |v|, whose area is the odometer reading. (Demo: car, distance vs displacement)
From ticks to the integral
A real tap does not jump once a minute; the rate changes all the time. Then a strip of width Δt is only close to the true amount, because r is not constant inside it. Make the ticks thinner and the sum of the strips gets closer to the true amount; in the limit it is the definite integral ∫0T r(t) dt. How fast the sums close in is shown on Riemann sums.
Read the other way, the amount grows at exactly the rate r: the slope of the water level is the height of the rate graph. That is the Fundamental Theorem of Calculus, the formal next step after this page. See also the derivative as a limit for slopes, improper integrals when the time runs to infinity, and Euler's method, which builds a curve by accumulating small steps of its rate.
What the page leaves out
Rates that change inside a tick (the step from sums to a limit is on the Riemann sums page), the formal definition of the integral, units other than litres and metres, a tank that overflows or runs dry (the rates are chosen so it does neither), and accumulation in more than one dimension, such as mass from a density.