The idea: tan = sin / cos
The tangent of an angle is the sine divided by the cosine:
tan x = sin x / cos xWhere cos x = 0 the division has no answer, so tan x does not exist there. Close to such a point cos x is tiny and tan x gets huge: the graph shoots up on one side and comes up from far below on the other. Those vertical lines are the vertical asymptotes, and between two of them the graph is one rising branch through a centre point where tan x = 0.
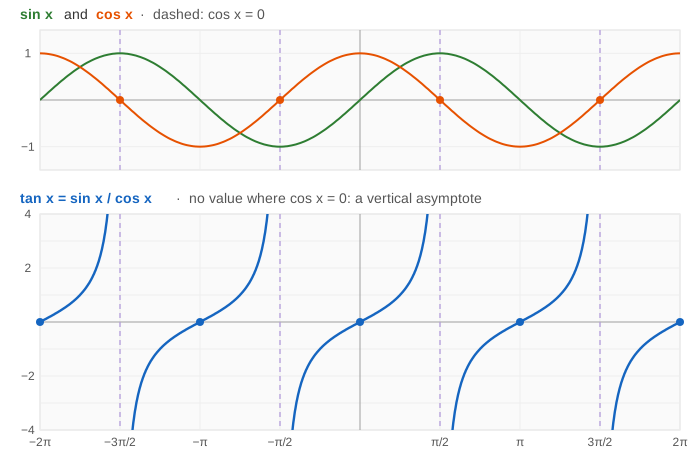
The full form y = a·tan(bx + c) + d has the same four knobs as the sine and cosine waves, and three of them do the same job. The fourth, a, is different: tan has no highest or lowest value, so there is no amplitude.
| coefficient | what it controls | formula |
|---|---|---|
| a | vertical stretch: a quarter period from a centre point the graph is at d ± a | slope a·b at the centre |
| b | period: the distance between two asymptotes | π/|b| |
| c | phase shift: where the centre point is | x = −c/b |
| d | midline: the height of the centre points | y = d |
Period π, not 2π
Half a turn changes the sign of both sine and cosine: sin(x + π) = −sin x and cos(x + π) = −cos x. The two minus signs cancel in the quotient, so tan(x + π) = tan x. tan repeats after π, half the period of sin and cos. With u = bx, one period needs bx to grow by π, so
period = π / |b|The period is also the distance from one asymptote to the next, and from one centre point to the next.
Vertical asymptotes
tan u does not exist where cos u = 0, at u = π/2 + kπ for every whole number k. With u = bx + c the asymptotes of y = a·tan(bx + c) + d are where
bx + c = π/2 + kπ → x = (π/2 + kπ − c) / bOnly b and c move them; a and d do not. The page draws them as light purple lines and never joins the curve across one: each branch runs from the bottom of the window to the top (or top to bottom when the graph is flipped). For other kinds of asymptotes see Types of Asymptotes.
a: a stretch, not an amplitude
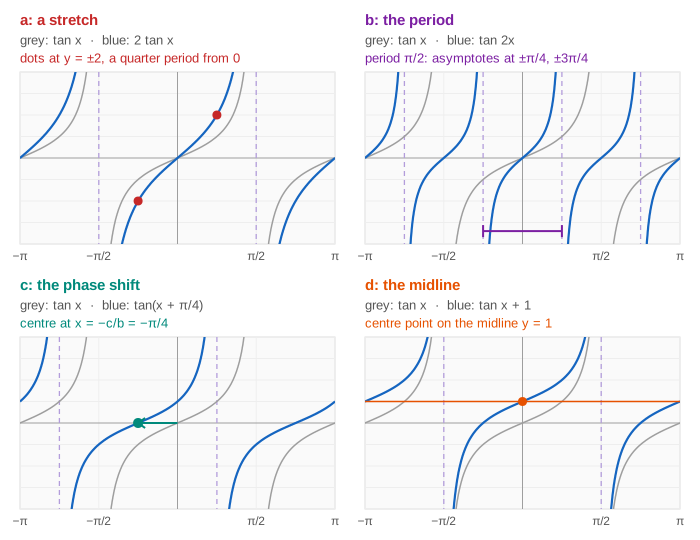
tan(π/4) = 1, so a quarter period to the right of a centre point tan x is at 1, and a·tan x is at a. The page marks these two points with red dots at y = d ± a. a = 2 makes the graph twice as steep: the slope at the centre point is a·b. A negative a flips the graph, so each branch falls instead of rising. The range is all real numbers whatever a is, which is why there is no amplitude. a = 0 leaves only the line y = d, still with gaps where tan does not exist. (Demo 2: a stretches it (no amplitude))
b: the period π/|b|
b = 2 halves the period to π/2 and puts the asymptotes twice as close; b = ½ doubles it to 2π. (Demo 3: b = 2 halves the period) With b = kπ/16 the period is 16/k: b = π gives period 1, with asymptotes at x = ±½, ±1.5, …
tan is odd, tan(−u) = −tan u, so a negative b flips the graph just as a negative a does: a·tan(−|b|x + c) + d = −a·tan(|b|x − c) + d. b = 0 makes bx + c = c for every x: the graph is the flat line y = a·tan c + d, and when tan c does not exist (c = π/2 + kπ) there is no graph at all. (Demo 6: b = 0, a flat line or nothing; Demo 1: b from π to −π in steps of π/16: the asymptotes spread out and leave the window as b gets close to 0, the graph is the line y = 0 at b = 0, then comes back flipped.)
c: the phase shift
The centre point is where the inside is 0: bx + c = 0, at x = −c/b. As for sine, the shift is c/b, not c: a·tan(bx + c) = a·tan(b(x + c/b)). The asymptotes move with the centre point. Two values of c are special:
- c = π/2: tan(x + π/2) = −cos x / sin x = −cot x. The asymptotes are now at x = kπ, where tan x had its zeros.
- c = π: tan(x + π) = tan x. A shift by one whole period changes nothing.
(Demo 4: c slides it (tan → −cot))
d: the midline
d is added to every y, so the whole graph slides up or down; the asymptotes stay. The centre points sit on the midline y = d. (Demo 5: d lifts it) Sliding and stretching any graph is the subject of Function Transformations.
Reading a, b, c, d off a graph
| read off the graph | gives |
|---|---|
| distance between two asymptotes | |b| = π / period |
| a centre point (xc, yc), halfway between two asymptotes | d = yc, c = −b·xc |
| height a quarter period right of the centre (b > 0) | a = that height − d |
Example, Demo 7: y = 2 tan(½x − π/4) + 1 has asymptotes at −π/2 and 3π/2, so the period is 2π and b = ½; the centre point is (π/2, 1), so d = 1 and c = −½·π/2 = −π/4; a quarter period further, at x = π, y = 3, so a = 3 − 1 = 2. The slope at the centre is a·b = 1 and the y-intercept is 2·tan(−π/4) + 1 = −1.
Compared with sin and cos
| a·sin(bx + c) + d, a·cos(bx + c) + d | a·tan(bx + c) + d | |
|---|---|---|
| period | 2π/|b| | π/|b| |
| a | amplitude |a| | a stretch: y = d ± a a quarter period out, slope a·b |
| range | [d − |a|, d + |a|] | all real numbers |
| asymptotes | none | x = (π/2 + kπ − c)/b |
| the point that moves with c | start of a cycle (sin: midline going up; cos: a peak) | centre point, on the midline |
| b < 0 | sin: flipped (odd); cos: no change (even) | flipped (odd) |
See Sine Waves: What a, b, c, d Do and Cosine Waves: What a, b, c, d Do. On The Unit Circle tan θ is the length of the tangent segment on the line x = 1: it grows without bound as θ nears 90°, where the radius is parallel to that line, which is the asymptote at π/2.
What the page leaves out
cot, sec and csc (only −cot appears, as tan shifted by π/2), the inverse function arctan, the derivative sec² x behind the slope a·b, angles in degrees, and graphs that need a bigger window than x ∈ [−2π, 2π], y ∈ [−4, 4].