The idea: four numbers, four jobs
A sine wave with all its knobs has the form
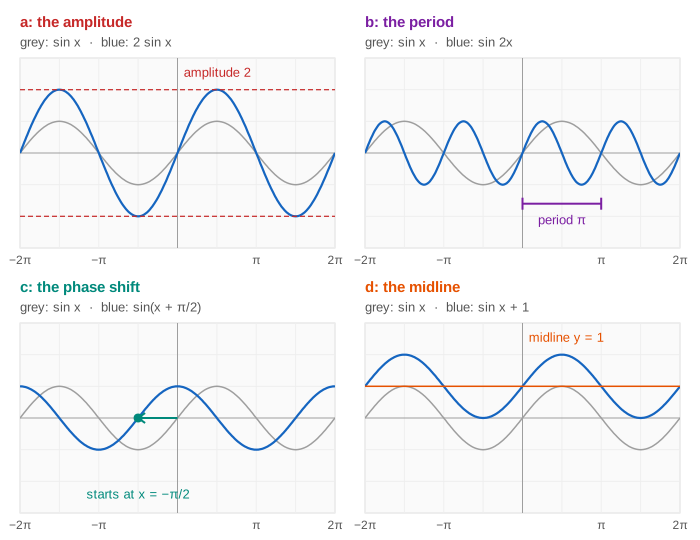
y = a·sin(bx + c) + dWithout them, y = sin x starts on its midline at x = 0, rises to a peak of 1 at π/2 and repeats every 2π. Each coefficient changes one thing you can read straight off the graph; the others stay where they were.
| coefficient | what it controls | formula |
|---|---|---|
| a | amplitude: how far the wave goes above and below its middle | |a| |
| b | period: how long one wave is | 2π/|b| |
| c | phase shift: where a cycle starts | x = −c/b |
| d | midline: the middle height | y = d |
a: the amplitude
sin u stays between −1 and 1, so a·sin u stays between −|a| and |a|. |a| is the amplitude: how far a peak is above the midline. a = 2 doubles the height, a = ½ halves it, and a negative a turns the wave upside down: where sin x has a peak, −sin x has a trough. a = 0 leaves only the flat line y = d. a does not change the period or the shift. (Demo 2: a, the amplitude)
b: the period
sin u repeats every 2π in u. With u = bx, one whole wave needs bx to grow by 2π, so x has to grow by 2π/|b|:
period = 2π / |b|b = 2 fits two waves where sin x had one (period π); b = ½ stretches one wave over 4π. So |b| counts how many waves fit into 2π. With b = kπ/16 the period is 32/k: b = π gives period 2.
b = 0 makes bx + c = c for every x, so the graph is the flat line y = a·sin c + d. A negative b mirrors the graph in the y-axis. Sine is odd, sin(−u) = −sin u, so sin(−x) is sin x turned upside down. (Demo 1: b from π to −π in steps of π/16: the wave flattens out as b gets close to 0, is the line y = 0 at b = 0, then comes back upside down.)
c: the phase shift
A cycle starts where the inside is 0: bx + c = 0, so at x = −c/b. That is the phase shift. A positive c/b moves the graph to the left, a negative one to the right. Factor out b to see it: a·sin(bx + c) = a·sin(b(x + c/b)), so the shift is c/b, not c.
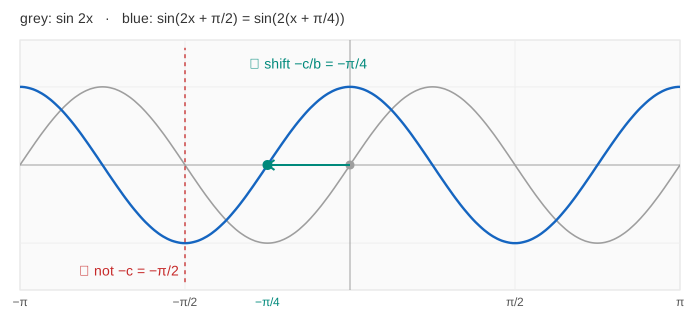
(Demo 5: the shift is −c/b, not −c) A quarter period turns sine into cosine, sin(x + π/2) = cos x, and half a period turns it upside down, sin(x + π) = −sin x. (Demo 4: c slides it sideways (sin → cos)) Adding 2π to c changes nothing: it is one whole cycle.
d: the midline
d is added to every y, so the whole wave slides up or down without changing shape. The midline y = d is halfway between the peaks and the troughs, and the values run over the range [d − |a|, d + |a|]. (Demo 3: d, the midline) Sliding and stretching any graph is the subject of Function Transformations.
Reading a, b, c, d off a graph
| read off the graph | gives |
|---|---|
| highest and lowest y | d = (max + min)/2, |a| = (max − min)/2 |
| distance from one peak to the next | |b| = 2π / period |
| where a cycle starts (on the midline, going up) | c = −b·xstart |
Example, Demo 6: y = 2 sin(½x − π/4) + 1 has max 3 and min −1, so d = 1 and a = 2; one wave is 4π long, so b = 2π/4π = ½; a cycle starts at x = π/2, so c = −½·π/2 = −π/4.
Sine and cosine are one wave
Cosine is sine shifted left by a quarter period: cos x = sin(x + π/2). So every a·cos(bx + c) + d is also a·sin(bx + c + π/2) + d, and everything on this page holds for cosine too, with the cycle starting at a peak instead of on the midline. See Cosine Waves: What a, b, c, d Do. Why the two are the same wave is clearest on The Unit Circle: sin is the height of a point going round, cos its x, and the x leads the height by a quarter turn.
For tan, whose period is π/|b| and which has vertical asymptotes instead of an amplitude, see Tangent Graphs: What a, b, c, d Do.
Two sine waves of the same wavelength that meet add up point by point: in step they make one wave twice as tall, half a wavelength apart they cancel. Two sources in a ripple tank do both at once: see Wave Interference: Two Coherent Sources.
Put a sine with a growing b inside a varying amplitude and it can draw a picture: on The Heart Curve, sin(mπx) swings between ∛(x²) ± √(3 − x²) and fills a heart as m goes from 0 to 20.
Plot two sine waves against each other instead of against time and you get a Lissajous figure: see Lissajous Figures: Two Sine Waves Drive One Pen.
What the page leaves out
tan and the other trig functions, writing p·sin x + q·cos x as one wave R·sin(x + φ), sums of waves (Fourier series), angles in degrees, and graphs that need a bigger window than x ∈ [−2π, 2π], y ∈ [−4, 4]. For a cubic instead of a wave, see Cubic Functions: What a, b, c, d Do.