The idea: a cost is only as good as its row estimate
A cost-based optimizer estimates the cost of each way to run a query and keeps the cheapest. The book lists five cost components: disk access, temporary storage, CPU, memory and communication. MariaDB's cost model counts mainly the first and the third: pages read from storage and rows processed by the CPU. Both depend on one number: how many rows each step returns. That number comes from the selectivity of each condition, the share of rows that pass it.
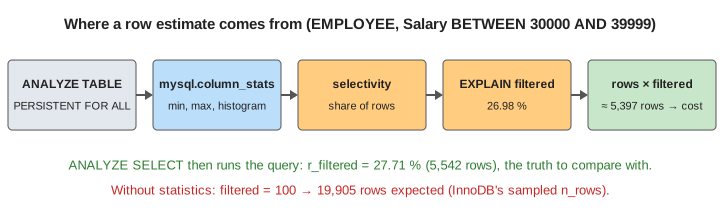
The page uses one table and one condition type. EMPLOYEE has 20,000 rows and a skewed Salary between 30,000 and 499,929, the range of the book's Figure 19.4. There is no index on Salary, so the plan is always a full scan (type = ALL). Only the estimate changes. Every statistic, histogram and percentage on the canvas was produced by MariaDB 13.1 on this table.
The catalog in MariaDB
The book says the optimizer reads the size of each file and the distribution of values from the catalog. MariaDB keeps two sets. InnoDB keeps sampled numbers by itself (mysql.innodb_table_stats.n_rows = 19,905 here, not quite 20,000). The engine-independent statistics are exact, and you collect them yourself:
| Book | MariaDB | EMPLOYEE |
|---|---|---|
| r, number of records | mysql.table_stats.cardinality | 20000 |
| NDV(A, R), distinct values | r / column_stats.avg_frequency | Salary: 20000 / 1.0862 ≈ 18,412 |
| s = sl · r, rows per value | column_stats.avg_frequency | Dno: 400 |
| value range | column_stats.min_value, max_value | 30000 … 499929 |
| (not in the book) | column_stats.nulls_ratio, avg_length | 0.0000, 4.0000 |
| histogram | column_stats.hist_type, histogram | see below |
| rows per index key | mysql.index_stats.avg_frequency per prefix | idx_dno: 400 |
They are filled by ANALYZE TABLE EMPLOYEE PERSISTENT FOR ALL (or FOR COLUMNS (…) INDEXES (…)). With the default use_stat_tables = PREFERABLY_FOR_QUERIES, a plain ANALYZE TABLE only refreshes InnoDB's numbers, and the optimizer uses the mysql tables whenever they have a row. MariaDB keeps no histogram for Ssn: it is the only column of the primary key.
Without a histogram: the uniform guess
With no column statistics at all, MariaDB cannot estimate a condition on an unindexed column. EXPLAIN shows filtered = 100 (Demo 1). With only min and max (histogram_size = 0) it makes the book's assumption that values are spread evenly:
The real share is 27.71 %, so the estimate is 13× too low. For Salary >= 200000 it is 63.82 % against 28.75 %, more than 2× too high (Demo 2). An equality uses avg_frequency / cardinality: about 1 row for Salary = 30000, which really has 258.
Height-balanced histograms: DOUBLE_PREC_HB and JSON_HB
The book describes equi-width buckets (equal value ranges) and equi-height buckets (equal numbers of rows), and calls equi-height better. MariaDB only builds equi-height ones, which it calls height-balanced. The type is set by histogram_type and the size by histogram_size (default 254):
DOUBLE_PREC_HB | JSON_HB | |
|---|---|---|
| default | MariaDB 10.4 to 10.11 | MariaDB 11.0 and later (exists since 10.8) |
what histogram_size means | bytes: 2 per endpoint, so 20 → 10 endpoints → 11 buckets | number of buckets |
| a bucket stores | its end as a 16-bit position between min and max | exact start value, size (share of rows), ndv |
| a range | counts every bucket it touches, 1/(n+1) each | full buckets + an even share of the edge buckets |
| a frequent value | can span several buckets | gets a bucket of its own with ndv = 1 |
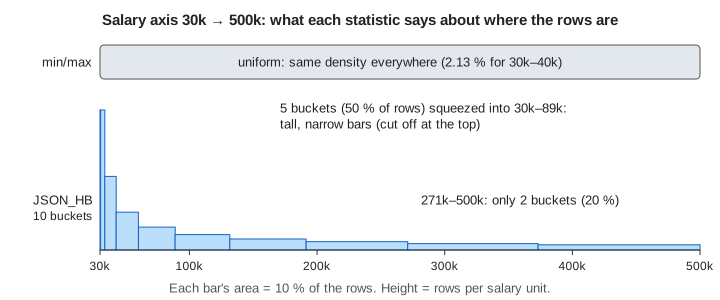
With 10 JSON_HB buckets, Salary BETWEEN 30000 AND 39999 covers buckets 0 and 1 fully (20.0 %) and 69.7 % of bucket 2, 33765–42709 (7.0 %): 26.98 % against the real 27.71 % (Demo 3). DOUBLE_PREC_HB with 11 buckets touches four of them and says 4/11 = 36.36 % (Demo 4). With the default 254 the estimates are almost exact:
| WHERE | min/max | DOUBLE_PREC_HB 20 | DOUBLE_PREC_HB 254 | JSON_HB 10 | JSON_HB 254 | real |
|---|---|---|---|---|---|---|
| 30000–39999 | 2.13 | 36.36 | 28.13 | 26.98 | 27.71 | 27.71 |
| 40000–69999 | 6.38 | 18.18 | 17.19 | 16.48 | 16.28 | 16.28 |
| 70000–119999 | 10.64 | 27.27 | 14.06 | 13.84 | 13.65 | 13.65 |
| 120000–199999 | 17.02 | 18.18 | 14.84 | 13.81 | 13.61 | 13.61 |
| >= 200000 | 63.82 | 27.27 | 28.13 | 28.89 | 28.75 | 28.75 |
| = 30000 | 0.01 | 0.01 | 2.34 | 0.02 | 1.29 | 1.29 |
The last row is the book's point about granularity. 258 rows have Salary = 30000. In a 10-bucket histogram they hide inside a bucket of 471 values, so JSON_HB guesses size / ndv = 0.02 %. With 254 buckets, 30000 fills a bucket by itself and the estimate is exact (Demo 5).
optimizer_use_condition_selectivity
Statistics in the tables are not enough: this variable decides which conditions get a selectivity at all.
| Value | Uses | Salary 30000–39999 |
|---|---|---|
| 1 | only conditions on indexed columns (the MariaDB 5.5 behaviour) | 100 |
| 2 | range conditions an index can check | 100 |
| 3 | all range conditions, from min/max | 2.13 |
| 4 (default since 10.4) | all range conditions, with histograms | 26.98 |
| 5 | like 4, plus sampling for some non-range conditions | 26.98 |
Demo 6 switches between 1, 3 and 4 with the same 10-bucket histogram in place.
Reading filtered and r_filtered
EXPLAIN EXTENDED, EXPLAIN FORMAT=JSON and ANALYZE show filtered: the estimated percentage of the rows examined that pass the table's conditions. rows × filtered is what the optimizer expects the next step to receive, and in a join it multiplies into the cost of every later table. ANALYZE SELECT also runs the query and adds r_rows and r_filtered, the measured values. When filtered and r_filtered differ by several times, collect statistics or add a histogram. The canvas shows tabular ANALYZE output, without its possible_keys, key_len and ref columns (all NULL here).
See also How a Query Planner Picks a Plan (PostgreSQL) for the same idea with pg_stats, and MySQL Index Access Paths and EXPLAIN for what changes when the column has an index.
What the page leaves out
The book's compiled vs interpreted queries (MariaDB optimizes every statement when it runs and has no stored plans), and catalog numbers MariaDB does not keep: block counts b, blocking factor bfr and index levels x come from the storage engine, not from a catalog table. Also left out: equi-width histograms (MariaDB has none), the older SINGLE_PREC_HB type, sampling with analyze_sample_percentage, histograms on several columns together (MariaDB has none, so correlated conditions are multiplied as if independent), the selectivity of conditions on indexed columns, which comes from the index (range estimates by index dives), and how filtered feeds join order and costs.
See where this page fits on the Databases & Storage mind map.