The idea: estimates first, then measure
The optimizer picks a plan from estimates: how many rows each step will read and how many it will keep. Section 19.7 of Elmasri & Navathe says every system can show that plan. In MariaDB, EXPLAIN prints the plan and its estimates without reading a row. ANALYZE picks the same plan, really runs the query, and prints the measured values next to the estimates. Where an estimate and its measured value disagree, the optimizer was planning for the wrong amount of data.
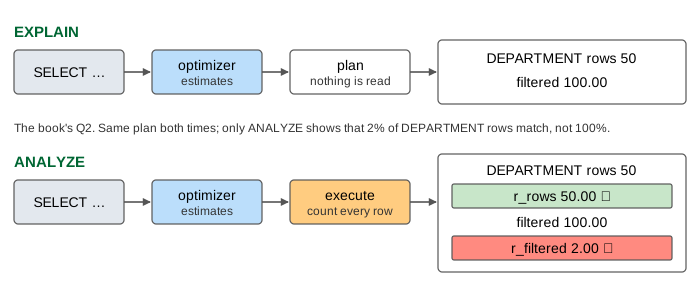
Every number on the canvas was printed by a MariaDB 13.1 server loaded with the book's Figure 19.6 data: EMPLOYEE 10,000 rows (index EMP_SAL on Salary), PROJECT 2,000 rows in 200 locations (index PROJ_PLOC), DEPARTMENT 50 rows with no index.
Reading the output
| Column | From | Meaning |
|---|---|---|
type | EXPLAIN | How the table is read: ALL full scan, index whole index in order, range, ref index lookup, eq_ref unique lookup (at most 1 row). |
key | EXPLAIN | The index used, NULL for none. |
rows | EXPLAIN | Estimated rows read from this table per lookup, not the size of the result. |
filtered | EXPLAIN | Estimated percentage of those rows left after this table's condition. |
r_rows, r_filtered | ANALYZE only | The same two numbers, measured while the query ran. |
Extra | EXPLAIN | Extra steps: Using filesort, Using temporary, Using join buffer (flat, BNL join), Using index condition. |
EXPLAIN FORMAT=JSON and ANALYZE FORMAT=JSON print the same plan as a tree with more fields: loops (how many times a table is expected to be visited) and r_loops, times in milliseconds, and for a sort the filesort node with r_limit, r_used_priority_queue and r_sort_mode. The canvas shows a few of these fields under the table.
A bad estimate in the book's Q2
The book's Q2 joins PROJECT, DEPARTMENT and EMPLOYEE for the projects in Stafford. MariaDB picks the book's plan: PROJECT through PROJ_PLOC (10 rows), DEPARTMENT by a full scan with the 10 PROJECT rows in a join buffer, then EMPLOYEE by primary key. EXPLAIN looks fine. ANALYZE shows that DEPARTMENT has filtered 100.00 but r_filtered 2.00: the condition Dnum = Dnumber on an unindexed column was not counted in the estimate. So the JSON says EMPLOYEE loops: 500, but r_loops: 10. The plan was still the right one here; on a bigger query a 50-times error is how a wrong join order gets picked. (Demo: EXPLAIN vs ANALYZE on the book's Q2)
Size of GROUP BY and DISTINCT
Section 19.7.2 says a GROUP BY on G returns NDV(G) rows, one per distinct value, and so does SELECT DISTINCT A. The size shows up in MariaDB when the result becomes a derived table, as the rows of <derived2>. For GROUP BY Dno it estimates 50, from mysql.column_stats: 10,000 rows / avg_frequency 200 = 50, and measures 50. For SELECT DISTINCT Dno it does not use NDV: estimate 10,000, measured 50. Same result, and only ANALYZE shows the gap. (Demo: GROUP BY vs DISTINCT size estimate)
Top-k: ORDER BY … LIMIT k
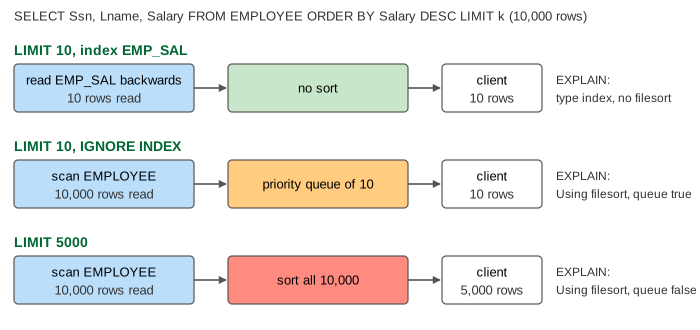
Section 19.7.4: if only the top k rows are wanted, sorting the whole result first is wasteful. MariaDB has the two strategies the book mentions, and picks between them by cost:
| Query on EMPLOYEE | EXPLAIN | Rows read | Sorted |
|---|---|---|---|
ORDER BY Salary DESC LIMIT 10 | index on EMP_SAL, no filesort | 10 | nothing: the index is in order |
same, IGNORE INDEX (EMP_SAL) | ALL, Using filesort | 10,000 | only the 10 kept in the priority queue |
ORDER BY Salary DESC LIMIT 5000 | ALL, Using filesort | 10,000 | all 10,000 |
- Read in order and stop.
EMP_SALis sorted by Salary, so reading it from the end gives the rows inSalary DESCorder; after 10 rows the scan stops. EXPLAIN showstypeindexand noUsing filesort. (Demo: top-10 with an index: read in order, stop) - Priority queue. Without a usable index every row must be read, but filesort keeps only the best 10 seen so far and drops the rest at once. Plain EXPLAIN only says
Using filesort;ANALYZE FORMAT=JSONshowsr_limit: 10andr_used_priority_queue: true. (Demo: top-10 without an index: priority queue) - Large k. Each index entry costs a row lookup by Ssn, so for many rows a scan plus a sort is cheaper. With this data the optimizer uses
EMP_SALup toLIMIT 3100and switches to filesort fromLIMIT 3200. AtLIMIT 5000the queue would be too big, so filesort sorts all 10,000 rows (r_used_priority_queue: false). (Demo: top-5000: the optimizer drops the index)
One quirk: for the index plan plain EXPLAIN prints rows 10, while ANALYZE prints rows 10000 with r_rows 10.00. In the top-k rows the gap between rows and r_rows comes from LIMIT stopping early, so the canvas does not mark it as an estimate error.
MariaDB vs the book
The book lists Oracle's EXPLAIN PLAN FOR, DB2, SQL Server's SHOWPLAN and PostgreSQL's EXPLAIN ANALYZE. MariaDB's ANALYZE plays the role of PostgreSQL's EXPLAIN ANALYZE: it runs the statement and prints the plan with measured values. For the optimizer's full reasoning (every plan it considered and its cost), MariaDB has SET optimizer_trace = 'enabled=on' and the information_schema.OPTIMIZER_TRACE table. See How a Query Planner Picks a Plan for the cost model behind the estimates, index access paths for ref, range and index, and join algorithms for the join buffer.
The priority queue behind ORDER BY … LIMIT is animated step by step in Top-k with a Size-k Heap.
What the page leaves out
Plan caching (book 19.7.3) is left out because MariaDB has no plan cache: the same prepared statement got a range plan on EMP_SAL for a narrow Salary range and a full scan for a wide one, so it is optimized again for each execution; the query cache (query_cache_type, off by default) stores result sets, not plans. Also left out: the book's size rules for set operations and outer joins, timings (r_total_time_ms, which depend on the machine), optimizer_trace output, SHOW ANALYZE for a running query, and the other systems' EXPLAIN syntax.
See where this page fits on the Databases & Storage mind map.