The idea: two ways to split points into groups
Both methods on this page look for K = 3 groups in the same 60 points, and both start from the same three points. k-means keeps one centre per group and gives every point to its nearest centre, all or nothing. A Gaussian mixture model (GMM) says the data came from 3 bell-shaped normal distributions, each with its own centre, its own shape and its own size, and asks for every point how likely each of them is to have produced it. It is fitted with the EM (expectation–maximisation) algorithm.
The left panel is k-means, the right panel the GMM, on the same points. The background shading shows which cluster would win a new point at that spot. Pick a data set with data, then press One iteration to see one step of both, or Run to convergence.
Hard vs soft assignment
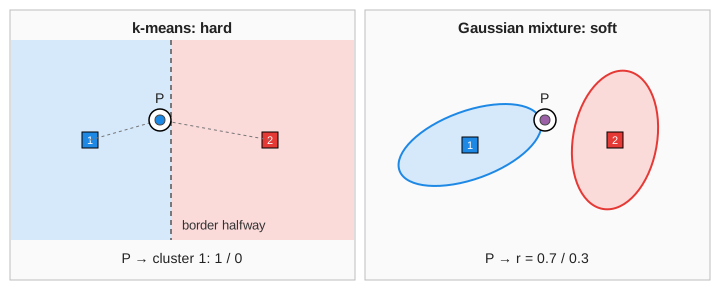
k-means makes a hard assignment: point P belongs 100% to cluster 1 and 0% to the others, even when it sits almost exactly between two centres. The GMM makes a soft assignment: the responsibility of Gaussian k for point x is
The three responsibilities of a point add up to 1. On the canvas a point's colour is the mix of the three cluster colours in those proportions, so a purple point is half blue, half red. The stats line point P gives the numbers for the ringed point (Demo 1: one iteration, walked through).
The two steps, side by side
Both algorithms repeat the same two steps until nothing changes.
| step | k-means | Gaussian mixture (EM) |
|---|---|---|
| assign / E-step | each point to its nearest centroid | responsibilities r for every point and Gaussian |
| update / M-step | centroid = mean of its points | mean μ = r-weighted mean; covariance Σ = r-weighted spread; weight π = (sum of r) / N |
| score that improves | inertia (SSE) Σ ‖x − μ‖², goes down | log-likelihood Σ log Σk πk N(x | μk, Σk), goes up |
| stops when | no point changes cluster | log-likelihood gains less than 0.001 per point |
| shape of a cluster | none stored (drawn: one circle for all) | an ellipse per cluster, from Σ |
Each step can only improve its score, so both always stop, but at a local optimum that depends
on where they started. That is why the page starts both from the same three points, one in each group.
The covariance gets a small 0.01 added to its diagonal (reg_covar) so it never collapses onto a single point.
k-means is a special case
Take a GMM where every Gaussian has the same round covariance σ²I and the same weight 1/K. Then the responsibilities only depend on the distance to each mean. Now let σ shrink towards 0: the nearest mean takes a responsibility of 1 and all others 0, and the M-step becomes a plain mean. That is k-means. So k-means quietly assumes that every cluster is round and the same size. The circles on the left panel show that assumption: radius 2σ with σ² = SSE / (2N), the same for all three.
Where k-means fails
The border between two k-means clusters is the straight line halfway between their centroids. That is the right border only when the two groups are round and equally spread.
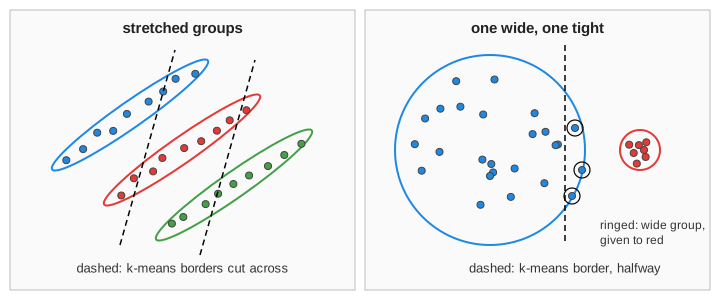
- Stretched groups (Demo 3): three long thin groups side by side. k-means' lowest-SSE answer cuts across them and agrees with the true groups on only 37 of 60 points. The GMM stretches each Σ into a long ellipse and gets all 60.
- Different sizes (Demo 4): a wide group of 36 next to two tight groups of 12. The halfway border gives the wide group's outer points to the tight ones (54 / 60). The GMM learns a wide Σ and a bigger weight π for the wide group (59 / 60).
On round groups of the same size (Demo 2) both agree on all 60 points: there the assumption is true and k-means is the cheaper choice. For groups that are not blobs at all (moons, rings), neither works; see DBSCAN.
Overlap and uncertainty
When two groups overlap (Demo 5), no method can be sure about the points in the middle. Both get about the same number right. The difference is what they say about it: k-means still puts every point 100% in one cluster, while the GMM gives 15 points less than 0.9 for any cluster. Those mixed-colour points are the ones a later step should treat with care, and the soft shading on the right shows the uncertain zone.
Choosing between them
| k-means | Gaussian mixture | |
|---|---|---|
| output | one label per point | a probability per point and cluster |
| cluster shape | round, all the same size | any ellipse, any size and weight |
| cost per iteration | N·K distances | N·K densities plus K covariance fits |
| iterations here | usually a few | usually more (slow final gains) |
| risks | wrong shape assumption, bad start | bad start, a Gaussian collapsing on few points |
In practice a GMM is often started from a k-means result, and both are run from several starts, keeping the best
score (n_init). To learn the basic k-means loop step by step, and how its start and K matter, see
K-Means Clustering.
What the page leaves out
K is fixed at 3; real use picks it with the elbow method, BIC or AIC. The start points are fixed, one per group, where libraries use k-means++ and several restarts. The GMM always uses full covariances; libraries also offer diagonal, spherical and tied ones. Real data has more than two dimensions, where the covariance has many more numbers to fit and EM needs more data and more regularisation.