The idea: start from what must not happen
A fault tree starts with one thing that must not happen, the top event. On this page it is "no cooling water reaches the tank". You then ask: what could cause this? Each answer is an event one level down. You keep asking until you reach basic events: single parts that fail, each with a known probability. Logic gates join the levels. The tree shows every way the top event can happen.
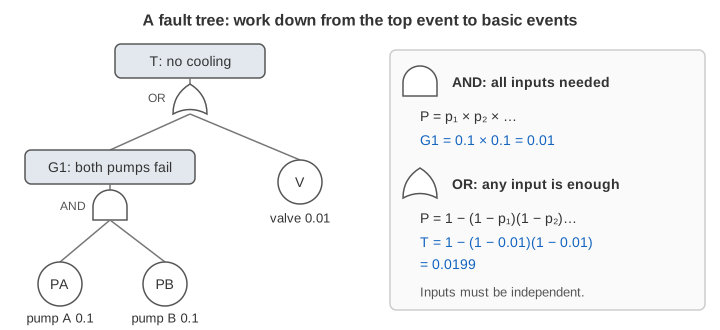
Pick a tree and press Cut Sets to watch MOCUS list the ways the cooling can stop, or Probability to roll the numbers up through the gates. The pumps fail with p = 0.1 (or 0.5 when worn), each power supply with 0.02, and the valve with 0.01. All basic events are independent.
Gates and basic events
An OR gate means any one input is enough to cause the output. A pump gives no flow if its motor fails or its power fails. An AND gate means all inputs must happen together. With two pumps, the cooling stops only if pump A and pump B give no flow. The valve sits on the top OR gate: if it sticks closed, no number of pumps helps.
A fault tree is about failure, so it is the mirror of a reliability block diagram. Parts in series (all needed) become an OR gate of their failures. Parts in parallel (any one is enough) become an AND gate.
Rolling probability up through the gates
If the inputs of a gate are independent:
- AND: multiply. P = p1 × p2 × …
- OR: the output does not happen only if no input happens. P = 1 − (1 − p1)(1 − p2)…
For one pump, GA = 1 − (1 − 0.1)(1 − 0.02) = 0.118, and T = 1 − (1 − 0.118)(1 − 0.01) = 0.12682 (Demo 2). Work from the leaves up, one gate at a time. Each gate's number appears in its box.
Cut sets and MOCUS
A cut set is a set of basic events that, if they all happen, cause the top event. A minimal cut set has no smaller cut set inside it. For one pump they are {V}, {PA} and {EA} (Demo 1). A minimal cut set with one event is a single point of failure.
MOCUS (Method for Obtaining Cut Sets) finds them with a table of rows:
- Start with one row: {T}.
- Take the gates from the top down. Replace an AND gate by all its inputs in the same row. Replace an OR gate by splitting the row: one new row per input.
- When only basic events are left, remove repeats inside a row ({PW, PW} is {PW}).
- Remove every row that contains another row (absorption). {PA, PW} goes, because {PW} alone already causes T.
For two pumps with their own power, the rows end as {V}, {PA, PB}, {PA, EB}, {EA, PB} and {EA, EB} (Demo 3). The same answer comes from Boolean algebra: write T as a sum of products and simplify with A + A·B = A.
Redundancy under an AND gate
A second pump puts an AND gate above the pumps. Every pump cut set now needs two events: {PA, PB} has probability 0.1 × 0.1 = 0.01 instead of 0.1. P(T) drops from 0.12682 to 0.023785 (Demo 4). A third pump gives 0.011627 (Demo 7). The gain is small now, because the valve's cut set {V} = 0.01 is left. Redundancy only helps the branch it sits in: the largest cut set outside the AND gate sets the floor.
| tree | minimal cut sets | exact P(T) |
|---|---|---|
| one pump | {V} {PA} {EA} | 0.12682 |
| two pumps, own power | {V} and 4 pairs | 0.023785 |
| three pumps, own power | {V} and 8 triples | 0.011627 |
| two pumps, shared power | {V} {PW} {PA, PB} | 0.039502 |
Common cause: one event under two branches
Now let both pumps run from one power supply PW. PW appears twice in the tree, once under each pump. It is a repeated event (orange on the canvas). MOCUS gives rows {PA, PB}, {PA, PW}, {PW, PB}, {PW, PW} and {V}. After removing the repeat and absorbing, the minimal cut sets are {V}, {PW} and {PA, PB} (Demo 5). The second pump no longer protects against a power failure: PW is a single point of failure again.
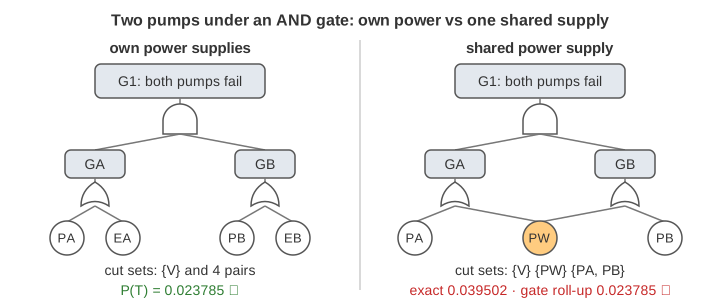
Here the gate roll-up breaks. It treats GA and GB as independent and multiplies 0.118 × 0.118, but both fail together whenever PW fails. It says 0.023785. The true value is 0.039502, and {PW} alone gives 0.02 of that (Demo 6). So: roll up gate by gate only when no basic event appears twice. Otherwise work from the minimal cut sets.
Rare-event approximation vs the exact value
The top event happens when at least one minimal cut set happens: P(T) = P(C1 ∪ C2 ∪ …). The quick estimate adds them up: P(T) ≈ Σ P(Ci). This rare-event approximation counts the cases where two cut sets happen at once twice, so it is always a little high (Boole's inequality). When every p is small, those overlaps are tiny. For two pumps the sum is 0.0244 against the exact 0.023785, 2.6 % high (Demo 4).
With worn pumps (p = 0.5) and three of them, the sum is 0.150608 against the exact 0.141324, 6.6 % high (Demo 8). The exact value needs inclusion–exclusion over the cut sets. The page gets it by going through every combination of the basic events (27 = 128 for three pumps). Real tools use binary decision diagrams instead. See Inclusion–Exclusion and the Pigeonhole Principle for the formula.
Fault trees in practice
Fault tree analysis came from Bell Labs in 1962, for the Minuteman missile launch control. It is now standard in nuclear plants (the NRC Fault Tree Handbook), aircraft certification and car safety (ISO 26262). It is a top-down method: it starts from one hazard. FMEA goes the other way, from each part's failure modes up to their effects. Engineers often use both. The ranked minimal cut sets tell you where to spend money: remove single points of failure first, then the largest cut sets.
See also Redundancy and Availability: TMR, N-Version and the Nines for series, parallel and 2-of-3 availability, Probability Tree Diagrams for multiplying along branches of outcomes, STRIDE Threat Modelling for attack trees, the same AND/OR idea for an attacker's goal, and RAID 0, 1, 5 and 10 for redundant disks.
What the page leaves out
Other gates (k-out-of-n voting, inhibit, priority-AND, NOT); time: failure rates, mission time and repair, so p becomes λt or an unavailability; importance measures such as Fussell–Vesely and Birnbaum; binary decision diagrams and the min-cut upper bound; dependent failures modelled with beta factors; uncertainty in the input probabilities; and event trees that follow an initiating event forward.