The idea: a test is a walk through a graph
White-box testing looks inside the code and asks: which parts did my tests run? To answer, draw the
function as a control-flow graph (CFG). Each statement is a node. An
edge (arrow) goes from a statement to every statement that can run right after it.
A decision, such as an if or a while condition, has two
edges going out: T when the condition is true and F when it is false.
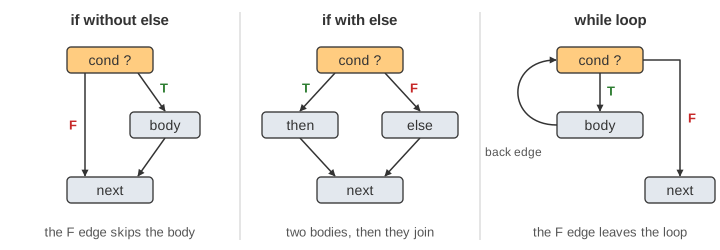
if and every loop adds one decision node with a T edge and an F edge.One test case runs the function once, so it walks one route from the first node to the last. The nodes and edges on that route are covered. A test suite covers everything that at least one of its tests walked over. The canvas shows this: press Run Test and watch the orange node move; what it leaves behind turns green.
The function share(bill, adults, kid) splits a bill. It has 6 statements, so 6 nodes,
and two ifs, so two decisions (nodes 2 and 4).
Demo 1: one test, 100% statements.
Three ways to count coverage
The same suite gets three different scores, because each criterion counts a different thing.
| Criterion | What must run | Total for share | After T1 alone |
|---|---|---|---|
| Statement coverage | every node | 6 nodes | 6/6 = 100% |
| Branch coverage | the T and the F edge of every decision | 4 outcomes: 2T 2F 4T 4F | 2/4 = 50% |
| Path coverage | every complete walk from entry to exit | 4 paths: TT TF FT FF | 1/4 = 25% |
T1 is share(60, 2, true). Both conditions are true, so the walk 1-2-3-4-5-6 visits
every node. But it never takes an F edge, and it is only one of four walks.
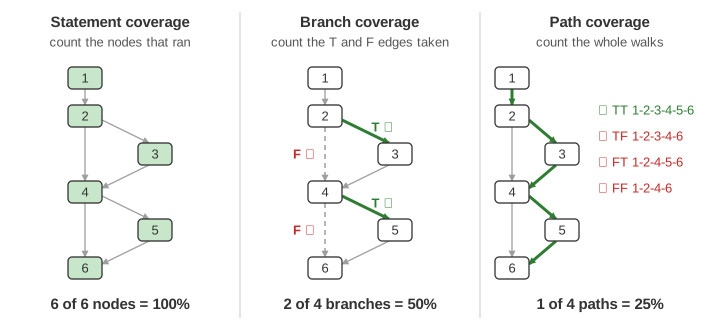
The criteria are ordered. Covering every path covers every branch, and covering every branch covers every statement. It does not work the other way round.
The bug that coverage misses
share has a bug. When adults is 0 and kid is false, both
ifs are skipped, people stays 0, and bill / people throws
ArithmeticException: / by zero. The bug lives on one path only: 1-2-4-6.
| Suite | Statements | Branches | Paths | Bug found? |
|---|---|---|---|---|
| T1 | 100% | 50% | 25% | ✗ no, all green |
| T2 + T3 | 100% | 100% | 50% | ✗ no, all green |
| T1 + T4 | 100% | 100% | 50% | ✓ yes, T4 fails |
| T1 + T2 + T3 + T4 | 100% | 100% | 100% | ✓ yes, T4 fails |
With T1 alone every statement has run and the suite is green. Statement coverage cannot see that
"skip the if" was never tried. Branch coverage asks for the F edges, and
Demo 2: add the false branches, bug found catches the bug with T4.
But branch coverage can be reached another way. T2 takes 2T and 4F; T3 takes 2F and 4T. Together they take all four branches, and both pass. The two F edges were never taken in the same run. Demo 3: 100% branches, bug still missed. Only running the path FF finds it (Demo 4: all four paths).
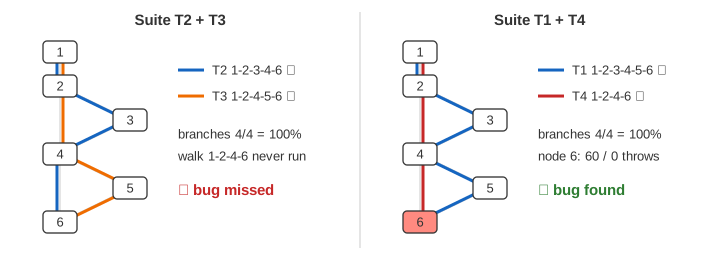
So coverage is a list of what has not been tested. Low coverage is a clear warning. High coverage is not a proof: it says the code ran, not that the result was checked or that every combination was tried.
Cyclomatic complexity V(G)
Thomas McCabe (1976) measured a function by its graph. With E edges and N nodes,
V(G) = E − N + 2For share: 7 − 6 + 2 = 3. A quicker way to the same number is
decisions + 1: two ifs give 2 + 1 = 3.
Demo 5: cyclomatic complexity V(G) = E − N + 2.
V(G) is the number of independent paths: a smallest set of walks from which every other walk can be built by combining them. It tells a tester two things:
- V(G) tests are always enough for 100% branch coverage (often fewer are needed: here 2).
- The function has at least V(G) paths (here 4).
It is also a warning sign for the programmer. Many teams ask for a function to be split when V(G) goes above about 10, because it needs too many tests and is hard to read.
Loops: paths without end
Pick the function countPositive. Node 5 has a back edge to node 2, so
a walk can go round the loop 0 times, once, twice and so on. Each count is a different path, and
the if inside doubles the choices on every round. There is no finite total, so the
page shows "paths seen" without a percentage.
One test, countPositive([5, -1]), takes every branch, because the two rounds of the loop
take 3T and 3F and the loop ends with 2F. Demo 6: loop, one test covers every branch.
The graph still has E = 7 and N = 6, so V(G) = 3, and the three short tests [],
[5] and [-1] walk three independent paths.
Demo 7: loop, three tests, three paths.
Since all paths cannot be run, testers pick a few loop counts on purpose: zero rounds, one round, and many rounds.
Coverage tools
A coverage tool records which lines and branches ran while the tests run. JaCoCo for Java reports
lines, branches and cyclomatic complexity per method; gcov does it for C and
coverage.py for Python. Reports colour each line green or red, like the code panel
here. No common tool reports path coverage.
See also Test Doubles for what a unit test checks and how it isolates the unit, Inside a Tiny Compiler for how source code becomes a tree before a tool can build a graph from it, and Depth-First Search for walking a directed graph.
See also Equivalence Partitioning and Boundary Value Analysis, the black-box way to pick tests from the specification alone.
See also Condition Coverage and MC/DC for testing an if with several conditions joined by && and ||, where each condition must be shown to change the outcome on its own.
See also Mutation Testing for a suite with 100% line coverage that still lets two of five mutants survive.
See also Three-Address Code, Basic Blocks and Local Optimizations to watch a compiler cut code into basic blocks and build the control-flow graph from leaders.
What the page leaves out
Basic blocks (tools merge straight-line statements into one node; V(G) stays the same), condition
coverage and MC/DC for compound conditions like a && b, short-circuit
evaluation, exceptions as extra edges, switch, break and
return in the middle of a function, data-flow (def-use) coverage, mutation testing,
and how tools instrument the code are left out. Choosing input values from the specification
(equivalence classes and boundary values) is black-box testing and is not covered here.