The idea: enroll once, compare every time
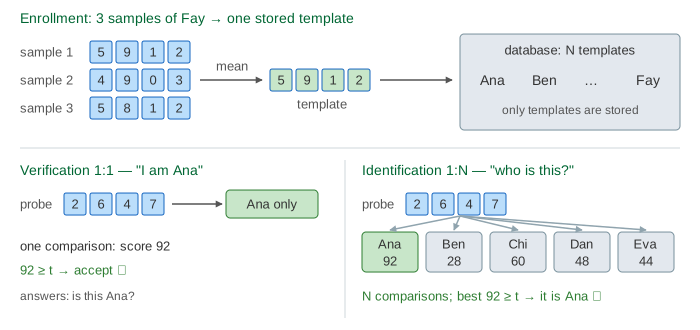
A biometric system recognises people by something they are: a fingerprint, a face, an iris, a voice. It never compares pictures directly. A feature extractor turns each sample into a short list of numbers, a feature vector. At enrollment a few samples of a person are combined into one stored template. Later, a new sample (the probe) is compared with templates, and a matcher gives a match score: high means "looks like the same person". A threshold t turns the score into a yes or no.
Verification 1:1 and identification 1:N
Verification checks a claim: "I am Ana". The probe is compared with Ana's template only: one comparison, one score. A phone unlock or a border gate with a passport works this way. Identification has no claim: "who is this?". The probe is compared with all N templates in the database, and the best score above t names the person; if none passes, the answer is "not enrolled". (Demo: verify 1:1, the genuine user is accepted: score 92 ≥ 64.)
Feature vectors and a match score
The page uses made-up vectors of 4 numbers from 0 to 9, not real faces or fingerprints. The matcher adds up the differences, feature by feature: distance d = Σ |probe − template|, and turns it into a score from 0 to 100: score = 100 − 4 × d. Ana's template is [2, 7, 4, 8]. Her good sample [2, 6, 4, 7] is 2 away, score 92. Her poor sample [0, 1, 4, 7], with one feature misread, is 9 away, score 64. A new sample is never exactly the template, so even the right person never scores 100. (Demo: enroll Fay, 3 samples → 1 template: the means 4.7, 8.7, 0.7, 2.3 round to [5, 9, 1, 2].)
Genuine and impostor scores: FAR and FRR
Run many test comparisons and sort them into two piles. Genuine scores compare two samples of the same person; impostor scores compare samples of different people. Genuine scores are mostly high, impostor scores mostly low, but the two piles overlap. The page's evaluation set has 20 of each. At a threshold t there are two kinds of mistake:
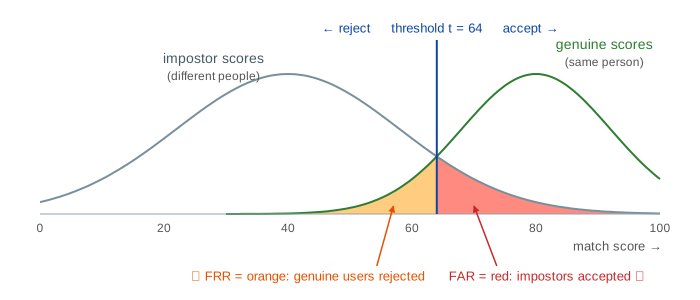
- False accept: an impostor scores ≥ t and gets in. FAR (false accept rate, also FMR, false match rate) = impostor scores ≥ t / all impostor scores.
- False reject: the right person scores below t and is turned away. FRR (false reject rate, also FNMR, false non-match rate) = genuine scores < t / all genuine scores.
The threshold trade-off and the EER
Raising t lowers FAR and raises FRR. When the piles overlap, no threshold makes both zero. The point where they are equal is the equal error rate (EER), a one-number summary of how good a matcher is: lower is better. (Demo: slide t, FAR against FRR, the EER: EER 10% at t = 64.)
| t | FAR (impostor ≥ t) | FRR (genuine < t) | feels like |
|---|---|---|---|
| 50 | 7/20 = 35% | 0/20 = 0% | convenient, easy to fool |
| 64 | 2/20 = 10% | 2/20 = 10% | the EER point |
| 72 | 0/20 = 0% | 5/20 = 25% | secure, annoying |
The EER is a way to compare systems, not the setting to use. A bank picks a high t, because a false accept costs money and a false reject only means "try again". A gym door picks a lower one. At t = 64 the look-alike who claims to be Ben (score 68) gets in; at t = 72 he is stopped, but Ana's poor sample (64) is now rejected too. (Demo: a look-alike is falsely accepted, until t rises; Demo: strict t falsely rejects a poor sample.)
Why 1:N needs a stricter threshold
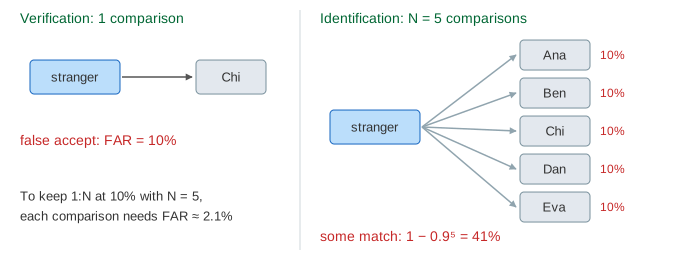
In verification an impostor gets one comparison, so one chance to pass. In identification a stranger is compared with every template, so N chances. If one comparison falsely matches with probability FAR, the chance that at least one of N does is
false match in 1:N = 1 − (1 − FAR)N ≈ N × FAR (when N × FAR is small).
With FAR 10% and only N = 5 templates that is 1 − 0.95 = 41%. The stranger in the demo is not enrolled, yet his probe scores 68 against Chi, which passes t = 64, and the system names him Chi. (Demo: identify 1:N, a stranger matches Chi.) To keep the 1:N false match rate at 10% with N = 5, each comparison needs FAR of about 2.1%; with a million templates, about one in ten million. So identification runs at a much higher t, and large systems often first narrow the search, then verify. At t = 72 the stranger matches nobody and Ana is still found, with 92. (Demo: 1:N with a strict t, stranger and Ana.)
Link to ROC curves
FAR is the false positive rate of the matcher, and FRR is 1 minus the true positive rate. So the FAR/FRR pair at every t is one point of a ROC curve; biometrics usually plots FRR against FAR on log axes and calls it a DET curve (detection error trade-off). Precision does not appear here, because a verification decision is judged per attempt; for precision and recall see Precision vs Recall.
See also Passkeys, where a fingerprint or face only unlocks a private key on the device and never leaves it, Password Hashing, for the other way to prove who you are, and k-Nearest Neighbours, which also labels a point by its distance to stored examples.
What the page leaves out
Real feature extractors (fingerprint minutiae, iris codes, face embeddings from neural networks) and their matchers, which use cosine or Hamming distance on hundreds of numbers. Quality checks that reject a bad sample before matching, liveness and presentation-attack detection (photos, masks, fake fingers), template protection and the privacy law around biometric data, failure to enroll and failure to acquire rates, score normalisation, fusing several fingers or traits, rank-k identification lists, and measuring FAR on millions of impostor pairs rather than 20.
On the mind map
References
NIST SP 800-63B, Digital Identity Guidelines: Authentication (biometrics requirements)
ISO/IEC 19795-1, Biometric performance testing and reporting
Biometrics (Wikipedia): FAR, FRR, EER, verification and identification
A. K. Jain, P. Flynn, A. A. Ross (eds.), Handbook of Biometrics, Springer