The idea: too simple vs too flexible
A model learns from a training set, but what we care about is how well it predicts new data. The page fits polynomials of degree 1 to 15 to the same 20 noisy points, drawn from y = sin(2πx) + noise with noise σ = 0.3. A separate validation set of 40 points (the red rings) is never used for fitting; its error stands in for "new data".
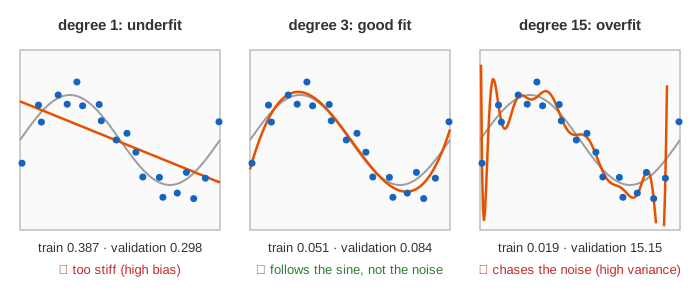
A degree-d polynomial has d + 1 coefficients, found by least squares (the fit with the smallest sum of squared residuals). Error is the mean squared error (MSE). (Demo: underfit, good fit, overfit.)
- Underfitting (degree 1): a straight line can't follow a wave. Train MSE 0.387 and validation MSE 0.298 are both far above the noise level σ² = 0.09.
- Good fit (degree 3): train 0.051, validation 0.084, close to the noise level. No model can do better than σ² on new data, because the noise can't be predicted.
- Overfitting (degree 15): 16 coefficients for 20 points. The curve bends to pass close to every point (train 0.019) and swings wildly between and beyond them (validation 15.15).
Train error vs validation error: the U
Each extra degree contains all the polynomials of the degree below it, so least squares can only fit the training points better: train error never goes up. Here it falls from 0.387 at degree 1 to 0.019 at degree 15. Validation error does something else: it falls to 0.084 at degree 3, stays near 0.1 up to degree 11, then climbs to 0.375 at degree 12, 7.0 at degree 14 and 15.15 at degree 15. (Demo: sweep 1→15.)
The gap between the two curves is the warning sign. Left of the bottom of the U the model underfits; right of it the model overfits. Low training error alone says nothing about a model: it is the validation error that you choose by.
Bias and variance
Imagine collecting a fresh training set many times and refitting the same degree each time. Two different things can go wrong:
- Bias: the average fit is in the wrong place. A line, however you draw the data, can't bend into a sine wave.
- Variance: the fits differ a lot from one training set to the next. A degree-15 curve depends on exactly where each noisy point landed.
For squared error, the expected error on a new point splits exactly into three parts:
expected error  =  bias²  +  variance  +  σ²
bias²     = (average fit − true f)²       averaged over x
variance  = spread of the fits around their average
σ²        = noise in y; no model can remove it
Resample ×5 draws 5 new training sets from the same source (the blue dots slide to each one), refits, and draws the 5 refits in light orange. It then averages 200 refits for the numbers and draws their mean in dark brown:
| degree | bias² | variance | bias² + variance + σ² | what you see |
|---|---|---|---|---|
| 1 | 0.203 | 0.010 | 0.303 | 5 almost identical lines, all wrong |
| 3 | 0.005 | 0.017 | 0.112 | 5 curves close together, around the sine |
| 15 | 0.69 | 333 | 334 | 5 curves that disagree wildly, worst at the edges |
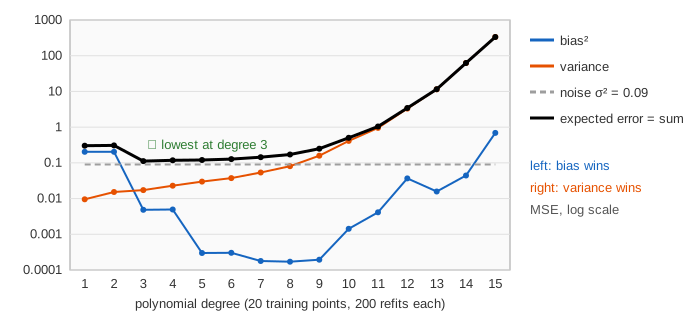
That is the bias–variance trade-off: more flexibility lowers bias and raises variance. (The small rise of bias² at degrees 12–15 is not real bias: with refits that wild, even the average of 200 of them is noisy.) Degree 1 and degree 15 fail for opposite reasons, so they need opposite cures. More data or regularization calms high variance; neither helps a model that is simply too stiff. (Demos: resample at degree 1, 15 and 3.)
Cross-validation: picking the degree
A separate validation set costs data you could have trained on, and with few points its error is itself noisy. k-fold cross-validation reuses the training set instead:
- Shuffle the training points and deal them into k equal folds (here k = 5 folds of 4 points).
- For each fold: fit the model on the other k − 1 folds (16 points), and compute its MSE on the held-out fold.
- The CV error is the mean of the k held-out errors. Do this for every candidate degree, pick the lowest, then refit that degree on all the data.
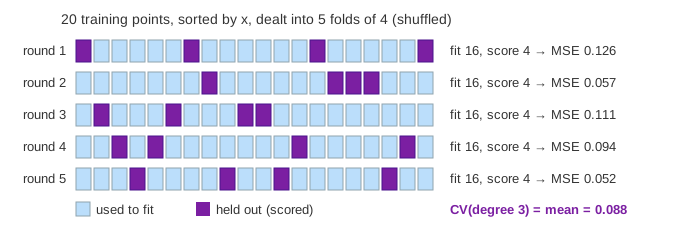
In Demo: 5-fold cross-validation the CV error is 0.594 at degree 1, 0.088 at degree 3, 0.091 at degree 4, 16 at degree 8 and about 4.5 million at degree 15. Each fold fits on only 16 points, so a degree-15 polynomial has to pass exactly through all 16 of them, and the held-out errors explode. CV picks degree 3, the same degree the validation set and the bias–variance numbers point to, without ever looking at the validation points.
Common choices are k = 5 or 10. Leave-one-out (k = n) uses the most data per fit but costs n fits. Data that must not be scored on is held back completely in a final test set, used once at the very end: after you pick a degree by its validation or CV error, that error is a little optimistic.
See also Linear & Logistic Regression (least squares and the MSE), L1 vs L2 Regularization (shrinking the weights instead of lowering the degree), and Random Forest vs Gradient Boosting (bagging cuts variance, boosting cuts bias).
What the page leaves out
The page knows the true function, so it can measure bias and variance directly; with real data you only see train, validation and CV errors. It uses one input and a polynomial family; real models have many knobs (tree depth, network size, λ, training epochs), and the same U shows up for each. It also leaves out stratified and grouped folds, time-series splits (never train on the future), nested cross-validation for honest error estimates, the variance of the CV estimate itself, and "double descent", where very large models such as neural networks can get better again past the point where they fit the training data exactly.