The idea: a Gather on top of the same plan
A PostgreSQL session is served by one backend process. For a big scan, that one process is the bottleneck, so the planner can make a parallel plan: an ordinary plan with a Gather (or Gather Merge) node on top of a parallel-aware subtree. The backend becomes the leader. It runs Gather and everything above it; extra background worker processes run copies of the subtree below it, and their rows come back to the leader through shared memory.
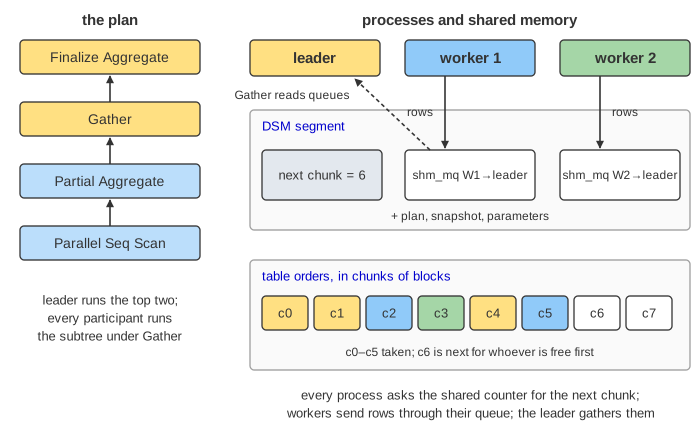
The page runs SELECT count(*) FROM orders WHERE amount > 900 on a 128 MB table. The plan, as EXPLAIN prints it:
Finalize Aggregate
  ->  Gather
        Workers Planned: 2
        ->  Partial Aggregate
              ->  Parallel Seq Scan on orders
                    Filter: (amount > 900)
Starting the workers
When the executor reaches Gather it sets up the parallel context:
- A dynamic shared memory (DSM) segment, created for this query. It holds the serialized plan, the snapshot (so every process sees the same rows under MVCC), the parameters, the shared state of each parallel-aware node, and one shm_mq tuple queue per worker.
- It registers dynamic background workers; the postmaster forks them. Each attaches to the DSM, restores the snapshot and runs its copy of the plan below Gather.
- The number planned comes from the table size (one worker at
min_parallel_table_scan_size= 8MB, one more each time the size triples: 128 MB allows 3), capped bymax_parallel_workers_per_gather(default 2). The number launched is also capped by free slots inmax_parallel_workers(default 8) andmax_worker_processes.
Forking takes time, so the leader does not wait: it starts scanning at once (Demo: parallel count(*), 2 workers).
Parallel Seq Scan: the next chunk
Nobody splits the table in advance. The scan's shared state in the DSM has one counter, the next block to hand out. Each participant atomically takes the next chunk of blocks, scans it, and comes back for more until the counter passes the end of the table. A process that is faster (its blocks were in cache, or it is not busy reading queues) simply takes more chunks. Since PostgreSQL 14 the chunks are groups of blocks (sized so a table has about 2048 of them, at most 8192 blocks each, and smaller near the end so everyone finishes together); before that it was one block at a time.
With parallel_leader_participation = on (the default) the leader is a participant too, and runs the subtree whenever no worker row is waiting. Turn it off and the leader only reads queues (Demo: leader does not participate).
Partial and Finalize Aggregate
An aggregate cannot simply run in each worker: three count(*) results are not the answer. PostgreSQL splits it. Partial Aggregate, below Gather, computes a transition state per process (here, a count) and returns one row. Finalize Aggregate, above Gather, combines those states (adds the counts). For avg the partial state is a sum and a count; an aggregate needs a combine function to be parallel-safe.
Gather vs Gather Merge
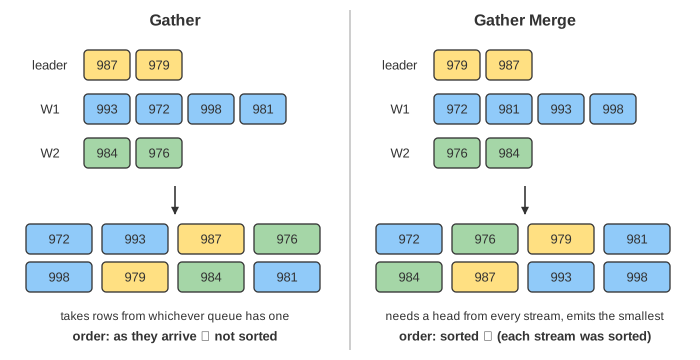
Gather reads whichever queue has a row, so its output has no order. When the rows must come out sorted, each participant sorts its own rows and Gather Merge merges the sorted streams: it waits for a head row from every participant and always returns the smallest one (Demo: Gather Merge for ORDER BY).
Parallel Hash Join
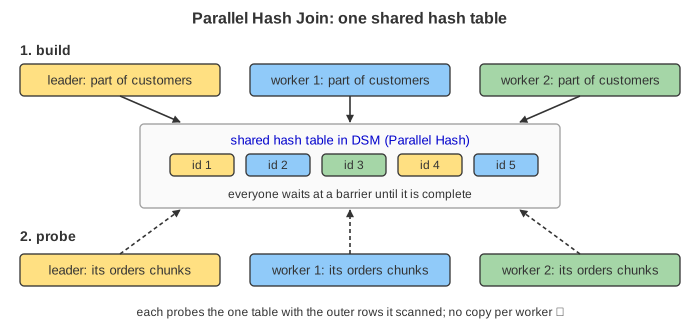
Joins run below Gather too. In a plain parallel hash join every participant builds its own full copy of the hash table from the inner side. With Parallel Hash (PostgreSQL 11+) they build one shared hash table in DSM together, each inserting the inner rows it scanned, wait at a barrier until it is complete, then each probes it with its own chunks of the outer table. Memory is counted once, and the build is parallel too.
When nothing runs in parallel
| Situation | What happens |
|---|---|
Table smaller than min_parallel_table_scan_size (8MB), or an index scan smaller than min_parallel_index_scan_size (512kB) | No parallel plan: the cost to start workers is more than it saves (Demo: small table, no parallel plan). |
max_parallel_workers_per_gather = 0 | Parallel query is off for the session. |
No free slot in max_parallel_workers at run time | The plan still has Gather, Workers Launched: 0, and the leader runs the whole subtree alone (Demo: no free workers), even with leader participation off. |
| The query writes (INSERT, UPDATE, DELETE), uses a parallel-unsafe function, or runs inside a cursor | No parallel plan (CREATE TABLE … AS SELECT and some other cases are allowed). |
Reading EXPLAIN ANALYZE
Workers Planned: 2vsWorkers Launched: 1: fewer slots were free at run time. A gap here explains a query that is slower some of the time.- Below Gather,
rowsis an average per loop andloopscounts the participants:rows=9 loops=3means about 28 rows in total, not 9. EXPLAIN (ANALYZE, VERBOSE)adds aWorker N:line per worker with its own rows and time, which shows uneven work.
What the page leaves out
The table is drawn as 16 large chunks with equal scan times; real chunks are much smaller and ramp down at the end. The page skips cost estimates (parallel_setup_cost, parallel_tuple_cost), queue back-pressure when the leader reads slowly, parallel index and bitmap heap scans, Parallel Append, parallel CREATE INDEX and VACUUM, and how workers report errors and instrumentation back to the leader. See How PostgreSQL Runs a Query for the serial path, the PostgreSQL process model for the postmaster and background workers, and PostgreSQL JOIN, GROUP BY and ORDER BY for the join and sort nodes.