The idea: one query becomes N+1
An ORM such as Hibernate lets you write a loop over objects instead of SQL. The N+1 query problem is what that loop can cost: 1 query loads a list of N parent rows, and then the loop touches a related collection of each parent, which sends 1 more query per parent. Five authors give six queries; a thousand authors give a thousand and one. Each query is fast. The time goes into the round trips.
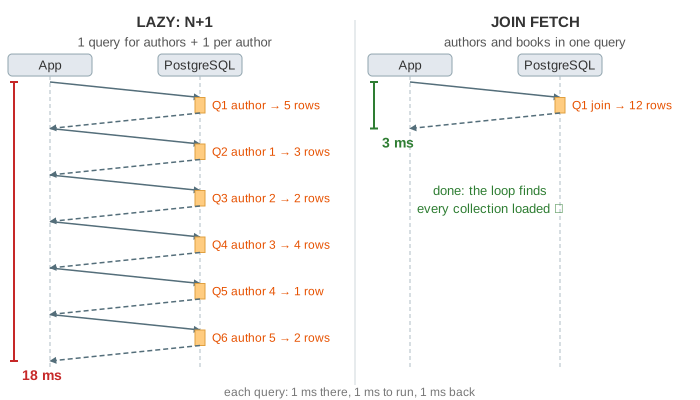
The page shows a Spring Boot application with Hibernate (JPA) and a PostgreSQL database with two tables: 5 author rows and 12 book rows. The endpoint GET /authors prints each author with the number of their books. One tick of the clock is 1 ms: the SQL travels 1 ms, PostgreSQL runs it in 1 ms and the rows come back in 1 ms, so every query costs 3 ms. Pick a fetch strategy and press Load /authors, or run a demo. The SQL log under the canvas shows every statement sent, like spring.jpa.show-sql=true does.
Why lazy loading does this
The collection is mapped like this:
@Entity
class Author {
    @Id Long id;
    String name;
    @OneToMany(mappedBy = "author")      // fetch = LAZY is the default for collections
    List<Book> books;
}
authorRepo.findAll() sends select a.id, a.name from author a. Hibernate builds 5 Author objects, but it does not read any books: each books field holds a proxy (a PersistentBag) that loads itself the first time it is used. The loop then calls a.getBooks().size(), and each call sends select … from book b where b.author_id = ?. Nothing in the Java code looks like a query (Demo: N+1, lazy loading in a loop).
Lazy loading is the right default: most code that reads an author does not need the books. It becomes a problem only when the code walks a list and touches the collection of every element.
It's the round trips
Each of those queries uses the index on book(author_id) and runs in about a millisecond. The database is idle most of the time. What adds up is waiting: send, wait, receive, then the next one. The number of round trips grows with N.
| Strategy | Queries for N authors | N = 5 | N = 100 | N = 1000 |
|---|---|---|---|---|
| LAZY in a loop | 1 + N | 6 · 18 ms | 101 · 303 ms | 1001 · 3003 ms |
| EAGER | 1 + N | 6 · 18 ms | 101 · 303 ms | 1001 · 3003 ms |
| JOIN FETCH | 1 | 1 · 3 ms | 1 · 3 ms | 1 · 3 ms |
| @BatchSize(25) | 1 + ⌈N / 25⌉ | 2 · 6 ms | 5 · 15 ms | 41 · 123 ms |
The 3 ms per query is a same-zone figure. If the database is in another availability zone or region, a round trip can be 1–80 ms, and 1001 of them take seconds to minutes. Real JOIN results are not free either: more rows take more time to send and parse. The page keeps transfer time at zero to show the round trips alone. Many small queries also hold a pooled connection longer, so N+1 can exhaust the pool under load.
EAGER is not the fix
A common first reaction is @OneToMany(fetch = FetchType.EAGER). For a JPQL query or a Spring Data findAll(), Hibernate first runs the query as written and then loads each eager collection with a secondary select: the same 1 + N queries, only earlier, before the loop starts (Demo: EAGER does not fix it). Worse, every other query that loads an author now loads its books too, even when nobody reads them. Hibernate's documentation recommends mapping associations lazily and choosing the fetch per query.
People often reach for EAGER because of LazyInitializationException: touching a proxy after the transaction and the persistence context are closed. Spring's open session in view (spring.jpa.open-in-view, on by default) avoids that exception by keeping the context open while the view renders, which also lets N+1 queries happen quietly in the template.
Fix 1: JOIN FETCH or an entity graph
Tell the query to bring the books along:
@Query("select a from Author a left join fetch a.books")
List<Author> findAll();

// or, the same with an entity graph
@EntityGraph(attributePaths = "books")
List<Author> findAll();
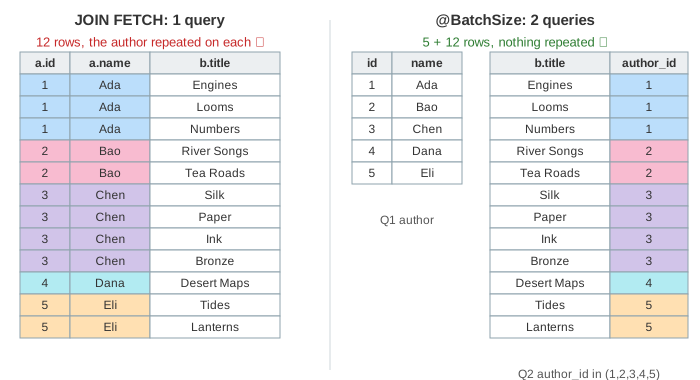
Hibernate sends one left join and fills every collection from the result: 1 round trip (Demo: fix 1, JOIN FETCH). The result is the join, so it has one row per book, and the author columns repeat on each: Ada comes back 3 times, Chen 4 times. Hibernate 6 folds the duplicates into 5 Author objects; older versions needed select distinct.
Two traps:
- Paging. With a collection fetch,
LIMITwould cut the books, not the authors. Hibernate warnsHHH90003004: firstResult/maxResults specified with collection fetch; applying in memoryand loads every row. Page the author ids first, then fetch their books. - Two collections. Joining
booksandawardsin one query multiplies the rows (a cartesian product). With twoLists Hibernate refuses withMultipleBagFetchException; fetch the second one in another query or with batching.
Fix 2: batch fetching
Keep the collection lazy, but let one proxy load its neighbours:
@OneToMany(mappedBy = "author")
@BatchSize(size = 25)
List<Book> books;

# or for every lazy association
spring.jpa.properties.hibernate.default_batch_fetch_size=25
When the loop touches Ada's proxy, Hibernate loads the books of every author in the persistence context that still has a proxy, up to 25 of them, with where b.author_id in (1, 2, 3, 4, 5) (on PostgreSQL Hibernate 6 sends = any(?) with an array). The loop then finds every collection loaded: 1 + ⌈N / 25⌉ queries and no repeated rows (Demo: fix 2, @BatchSize). @Fetch(FetchMode.SUBSELECT) goes one step further and loads the books of all the authors with a subquery that repeats the first query.
| JOIN FETCH / entity graph | Batch fetching | |
|---|---|---|
| Round trips | 1 | 1 + ⌈N / size⌉ |
| Rows sent | one per child, parent repeated | parents + children, no repeats |
| Paging the parents | trap (in-memory paging) | works |
| Several collections | cartesian product | one batch per collection |
| Where you write it | per query | once, on the mapping or globally |
When the page only shows numbers, a third fix is not to load entities at all: a DTO projection or select a.name, count(b) from Author a left join a.books b group by a.name sends one query and returns 5 rows.
Finding it
N+1 is invisible in the code and obvious in the SQL. Ways to see it:
- The SQL log (
spring.jpa.show-sql, ororg.hibernate.SQLat DEBUG): the same statement with a different parameter, N times in a row. - Hibernate statistics (
hibernate.generate_statistics=true):Statistics.getPrepareStatementCount()per request. - A test that asserts the number of statements for an endpoint, so a new lazy access fails the build.
- An APM trace (OpenTelemetry, Datadog, …): a staircase of identical short database spans under one request.
The counters on the canvas are that query count, and the line under them shows what the same code costs with 100 or 1000 authors.
Not only Hibernate
| Stack | N+1 comes from | Fix |
|---|---|---|
| Django ORM | author.book_set.all() in a loop | select_related (join, for foreign keys), prefetch_related (second query with IN) |
| Rails Active Record | author.books in a view | includes, preload, eager_load; the Bullet gem warns |
| Entity Framework Core | lazy-loading proxies | Include, AsSplitQuery |
| GraphQL | one resolver call per item | DataLoader: collect the keys of one tick, load them in one batch |
| Microservices | one HTTP call per item | a bulk endpoint (GET /books?authorIds=1,2,3) |
See also How a Query Planner Picks a Plan for what PostgreSQL does with the join, B+ Tree as a Database Index for why each small query is cheap, Database Connection Pool, Cache Strategies and Latency vs Throughput.
What the page leaves out
- Transfer and parsing time: a join that repeats wide parent columns sends more bytes.
- The second-level cache and the query cache, which can serve some of the N queries from memory.
- N+1 on the other side of the association (
@ManyToOne, which is EAGER by default in JPA) and nested N+1 (books → reviews). - Writes: inserting N rows one statement at a time, fixed with JDBC batching (
hibernate.jdbc.batch_size). - The exact SQL Hibernate prints: aliases like
a1_0, and= any(?)instead of anINlist on PostgreSQL.