The idea: a gas is balls that fly and bounce
The page models a gas the way kinetic theory does: many small balls that fly in straight lines and bounce off the walls and off each other, with no other forces. Each ball here is a disc in a flat (2-D) box, 100 × 100 units, with mass m = 1 and radius 1. Every bounce is elastic: momentum and kinetic energy are kept. The units are set so that Boltzmann's constant is k = 1. From this one picture come pressure, temperature, the ideal gas law and the spread of speeds.
Pressure is wall hits
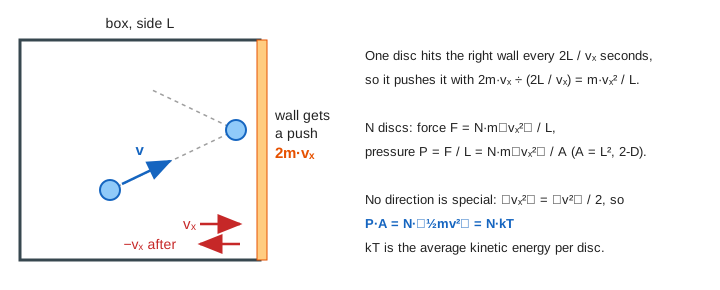
When a disc hits a wall, its velocity across the wall flips from vₙ to −vₙ. Its momentum changes by 2m|vₙ|, so the wall gets that push. Pressure is the total push per unit of time per unit of wall length (in 3-D: per unit of wall area). The page adds up every hit on all four walls and divides by the time and the wall length. The trace panel shows this running value: it wobbles at first and settles as hits add up (Demo 2).
Temperature is average kinetic energy
The figure above shows why the push depends on ⟨vₓ²⟩: a faster disc hits harder and more often. No direction is special, so in 2-D ⟨vₓ²⟩ = ⟨v²⟩/2 and P·A = N·⟨½mv²⟩. The ideal gas law says P·A = N·kT, so kT is the average kinetic energy per disc. Each direction a disc can move in holds ½kT (equipartition): 2 directions in 2-D give kT, 3 in 3-D give 3/2·kT. Collisions only pass energy from one disc to another, so the total kinetic energy, and with it T, never changes on the page.
From one speed to the Maxwell–Boltzmann curve
Every disc starts at the same speed v₀ = 1, so the histogram starts as a single spike. When two equal discs collide they swap the parts of their velocities along the line between their centres. That almost always makes one faster and the other slower, so the spike spreads. After a few collisions per disc the histogram settles into the Maxwell–Boltzmann distribution and stays there, up to the wobble of counting 100 discs (Demo 1).
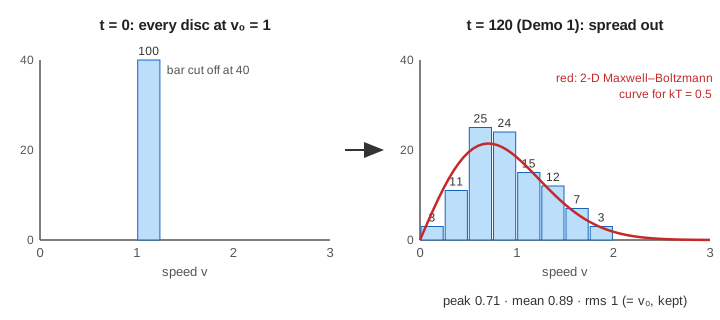
The page's box is flat, so its curve is the 2-D form. The 3-D gas in a real room has an extra factor of v, because there are more directions to point a fast velocity in:
| speed | 2-D (the page) | kT = 0.5, m = 1 | 3-D |
|---|---|---|---|
| most likely (peak) | √(kT/m) | 0.707 | √(2kT/m) |
| mean | √(πkT/2m) | 0.886 | √(8kT/πm) |
| rms √⟨v²⟩ | √(2kT/m) | 1 = v₀ | √(3kT/m) |
Few discs are almost at rest: to be slow, both vₓ and vy must be near 0, a small target. That is why the curve starts at 0. The long tail on the right holds the rare fast discs; in a real gas they are the ones that evaporate first or get over a reaction's energy barrier.
PV = NkT on the page
In 2-D the ideal gas law is P·A = N·kT. Demos 2 to 5 run 40 frames (t = 200) and compare the measured P·A with N·kT. Halving the discs halves the pressure; doubling every speed makes kT four times larger and the pressure too; halving the box doubles the pressure (Boyle's law).
| demo | N | kT | A | ideal P | measured P | P·A ÷ N·kT |
|---|---|---|---|---|---|---|
| 2: start gas | 100 | 0.5 | 9604 | 0.00521 | 0.00554 | 1.06 |
| 3: half the discs | 50 | 0.5 | 9604 | 0.00260 | 0.00262 | 1.01 |
| 4: v₀ = 2 | 100 | 2 | 9604 | 0.0208 | 0.0215 | 1.03 |
| 5: half the box | 100 | 0.5 | 4704 | 0.0106 | 0.0118 | 1.11 |
A is the area the disc centres can reach, (100 − 2)·(100 − 2) = 9604, because a centre stays one radius away from each wall.
Why it comes out a little high
The ideal gas law treats molecules as points. The discs take up room, so each one has a little less space to fly in and hits the walls a little more often than points would. The denser the gas, the bigger the effect: 1.01 with 50 discs, 1.06 with 100, 1.11 with 100 discs in half the box. The rest of the gap is the wobble of counting a few hundred hits. Real gases show the same thing at high pressure; the van der Waals equation fixes it with a term b for the room each molecule takes up (and a term a for the pull between molecules, which the page's discs do not have).
Mixing: entropy that does not come back
In Demo 6 a wall keeps 50 blue discs on the left and 50 orange ones on the right. When the wall is lifted, nothing pushes the gases into each other: the discs just keep flying, and now nothing stops them at the middle. Soon each half holds a mix. The entropy S = k·ln Ω counts how many arrangements look the same. The page counts by halves: for each half with n discs, a fraction x of them blue, S adds −k·n·[x ln x + (1 − x) ln(1 − x)]. It starts at 0 and climbs to about N·k·ln 2 = 69.3 k, the value for 50/50 halves, and then only wobbles near the top.
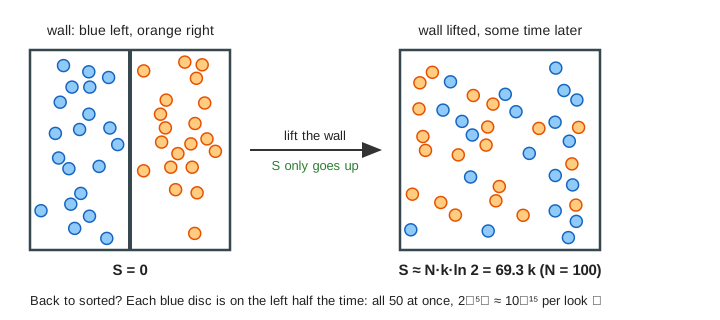
Every collision on the page could run backwards: the laws of motion do not care about the direction of time. The mixing still does not undo itself, because sorted arrangements are so rare. Each blue disc is on the left about half the time, so all 50 of them at once has a chance of about 2⁻⁵⁰ ≈ 10⁻¹⁵ per look, and with the orange ones on the right too, 2⁻¹⁰⁰. For a real gas with 10²³ molecules the chance is beyond any number worth writing down. That one-way climb is the second law of thermodynamics.
See also
How two discs share momentum and energy in one collision is on Collisions in 2-D and, head-on, on Elastic Collision. Another bell shape that comes from adding up many small random pushes is on Normal Distribution and Central Limit Theorem: each velocity part vₓ of a gas disc is in fact normally distributed.
What the page leaves out
A real gas is 3-D and has about 10²³ molecules, not 100 discs; molecules spin and vibrate, which stores more energy per degree of temperature; they pull on each other a little when close (van der Waals a), which makes gases condense. The page also skips gravity, walls that are warm or cold (heat flow), moving pistons (work), and the quantum effects that matter at very low temperature. Collisions are found once per tick (dt = 0.5), so two discs may overlap slightly before they bounce; the page measures pressure from the start, with no warm-up.