The idea: more pods, then more nodes
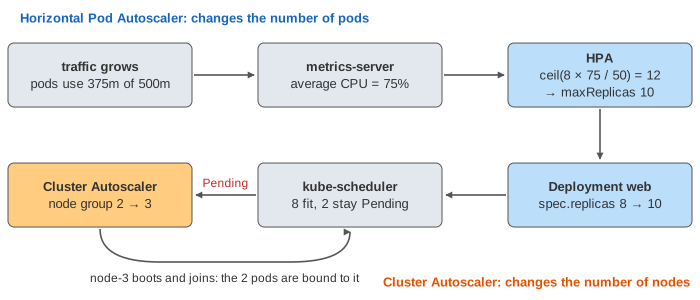
Kubernetes scales an app on two levels. The Horizontal Pod Autoscaler (HPA) changes how many pods a Deployment runs, from the pods' CPU use. It never adds machines. If the new pods don't fit on any node, they stay Pending, and the Cluster Autoscaler adds a node to the cluster so the scheduler can place them. Both are control loops: they look at the cluster again and again and change one number.
Reading the canvas: the HPA CONTROLLER panel shows the HPA's settings, the arithmetic of the last sync and its window of past recommendations. WORKLOAD AND CLUSTER AUTOSCALER holds the traffic, metrics-server, the Deployment web, kube-scheduler, the Cluster Autoscaler and the cloud node group. The CLUSTER shows each node's four pod slots (2000m of CPU, 500m per pod) and the pods that are Pending. Pick a load, then press Next Sync (+15 s) or Wait 1 min, or run a demo.
The HPA formula
Every 15 seconds (--horizontal-pod-autoscaler-sync-period) the HPA reads the CPU of each pod from the metrics API, which metrics-server fills from the kubelets. It averages the use as a percentage of the pod's CPU request (not of the node, and not of a limit) and computes:
desiredReplicas = ceil( currentReplicas × currentUtilization / targetUtilization )
With 4 pods at 100% and a target of 50%, that is ceil(4 × 100 / 50) = 8. The formula assumes the load splits evenly, so twice as many pods each get half (Demo 2: traffic doubles). On the canvas the HPA is set up like this:
apiVersion: autoscaling/v2
kind: HorizontalPodAutoscaler
spec:
  scaleTargetRef: {kind: Deployment, name: web}
  minReplicas: 2
  maxReplicas: 10
  metrics:
  - type: Resource
    resource:
      name: cpu
      target: {type: Utilization, averageUtilization: 50}
The HPA only writes spec.replicas through the Deployment's scale subresource. The ReplicaSet controller creates or deletes the pods.
The 10% tolerance
The ratio current / target is never exactly 1, because load is noisy. If it is within 0.1 of 1 (--horizontal-pod-autoscaler-tolerance, and per HPA in behavior in newer versions), the HPA does nothing. 54% against 50% is a ratio of 1.08: no change. 60% is 1.20: ceil(4 × 1.2) = 5 pods (Demo 1: tolerance). After that 1.2 CPU over 5 pods is 48%, inside the band again, so the HPA settles.
Limits: min, max and the scale-up rate
The result is clamped to minReplicas and maxReplicas; the HPA reports ScalingLimited when it hits one. By default a scale-up may at most double the pods, or add 4, per 15 s, whichever is more. In Demo 3 the formula asks for 12 pods, and maxReplicas caps it at 10.
Pods that are not Ready
A Pending or starting pod has no CPU numbers. When scaling up, the HPA counts such pods as using 0% and checks the ratio again. Without that rule, each sync would see the old pods still busy and add more pods on top of the ones already coming. In Demo 3 the 8 Ready pods are at 75%, but over all 10 pods it is 60%, which still says 10, so nothing is added while node-3 boots.
The scale-down stabilization window
Removing pods too fast is dangerous: traffic often dips for a minute and comes back, and new pods take time to start. So the HPA stores every recommendation, and for a scale-down it uses the highest recommendation of the last 300 seconds (behavior.scaleDown.stabilizationWindowSeconds, default 300). The strip of 20 cells on the canvas is that window, one cell per sync. Scale-ups have a window of 0 s by default, so they happen at once.
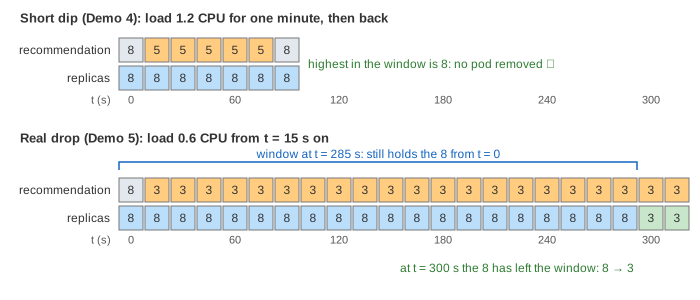
In Demo 4: a short dip the load falls to 1.2 CPU for a minute: 8 pods at 30% give a recommendation of 5, but the window still holds 8s, so no pod goes. When the load comes back, 8 pods are still there. In Demo 5: a real drop the load falls to 0.6 CPU and stays: the recommendation is 3 from t = 15 s, and the HPA scales 8 → 3 at t = 300 s, when the last 8 has left the window.
Cluster Autoscaler: a node for Pending pods
The HPA can ask for pods the cluster has no room for. The scheduler places a pod only on a node whose free requests cover the pod's request; if there is none, the pod stays Pending with the reason Unschedulable. The Cluster Autoscaler checks every 10 seconds (--scan-interval) for such pods. It simulates the scheduler on a new node built from a node group's template, and if the pods would fit there, it raises the desired size of that cloud node group (an AWS Auto Scaling group, a GCE managed instance group, an Azure VM scale set). The VM boots, its kubelet registers the node, and the scheduler binds the Pending pods to it (Demo 3: pods Pending).
It works the other way too: a node whose pods request less than half of its CPU (--scale-down-utilization-threshold=0.5) for 10 minutes (--scale-down-unneeded-time), and whose pods fit elsewhere, is drained and removed. The Cluster Autoscaler looks only at requests, not at real use: a pod without a CPU request never triggers a new node.
VPA in a sentence
The Vertical Pod Autoscaler keeps the pod count and changes each pod's requests instead: it watches what the containers really use and recommends (or, in Auto mode, applies by recreating pods) requests that fit. Don't let the VPA and the HPA both act on CPU for the same pods, because the HPA's percentage is computed against the request the VPA keeps moving.
| HPA | VPA | Cluster Autoscaler | |
|---|---|---|---|
| Changes | number of pods | requests of each pod | number of nodes |
| Looks at | CPU, memory or custom metrics vs a target | past use of each container | Pending pods, underused nodes |
| Speed | 15 s sync; scale-down held 300 s | minutes to hours | seconds to decide, minutes to boot a VM |
| Part of | kube-controller-manager | add-on (recommender, updater, admission webhook) | add-on run per cloud |
See also Kubernetes Cluster Architecture for the controllers and the scheduler, The Life of a Kubernetes Pod for what a Pending and a starting pod go through, and Vertical vs Horizontal Scaling for the two ways to grow in general.
What the page leaves out
Memory, custom and external metrics (an HPA with several metrics takes the highest result); the 5-minute CPU initialization period for new pods; scale-up and scale-down policies beyond the defaults; KEDA and scaling to zero; the HPA's selectPolicy; pod disruption budgets and the drain during a node scale-down; node startup taints, DaemonSets and system pods that use part of a node's CPU; Karpenter, which picks the instance type itself instead of growing a fixed group; and the real timing noise of metrics-server's scrapes.