The idea: compare three numbers on the same date
A status report that says "we have spent 30 of our 100" tells you very little. Is 30 a lot for this point in time? Did the 30 buy the work it should have? Earned value management (EVM) answers both questions with three numbers, all in money and all taken at the same status date. Planned value (PV) is the budget of the work the plan says should be done by now. Earned value (EV) is the budget of the work that really is done. Actual cost (AC) is what that work cost. EV is the key. It puts the work done into the same units as the plan and the spending.
The plan and planned value
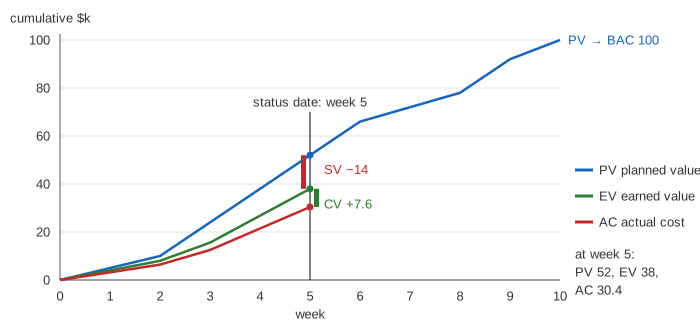
The project on this page has 5 tasks and a budget at completion (BAC) of 100 ($k), over 10 weeks. Each task's budget is spread evenly over its weeks. Adding up, week by week, the budget of the work planned so far gives the PV line. It is flat at the start, steep in the middle when Backend and Frontend run side by side, and it ends at BAC. This shape is often called an S-curve.
| Task | Weeks | Budget | Per week |
|---|---|---|---|
| Design | 1–2 | 10 | 5 |
| Backend | 3–6 | 32 | 8 |
| Frontend | 3–6 | 24 | 6 |
| Testing | 7–9 | 18 | 6 |
| Launch | 9–10 | 16 | 8 |
| BAC | 100 |
PV at the end of weeks 1 to 10: 5, 10, 24, 38, 52, 66, 72, 78, 92, 100. Which task has to come before which, and which ones set the end date, is the job of the critical path method. EVM takes the dated plan as given and measures progress against it.
Earned value: budget × % complete
For each task, multiply its budget by how much of it is done, then add up. In project C at week 5, Design is 100% done, Backend 50% and Frontend 50%: EV = 10 + 16 + 12 = 38. The plan wanted 52 by now. The tick on each bar on the canvas shows where the plan says that task should be. EV never goes past BAC: when every task is done, EV = BAC (Demo: earning value week by week).
EV counts the budget of the work, not its cost. If Backend is half done, it has earned 16 of its 32, whatever was paid for it.
Actual cost, and the trap of comparing AC with PV
AC comes from the timesheets and invoices: the money spent on the work up to the status date. It is tempting to compare AC with PV. Project D at week 5 has spent 47.5, less than the 52 planned, which sounds good. But it has done only 38 of work. That 38 of budgeted work cost 47.5, so the project is over budget and behind (Demo: spent less than planned, still over budget). Spending less than planned can simply mean doing less than planned.
Variances and indices
| Measure | Formula | Bad when | Question |
|---|---|---|---|
| Schedule variance | SV = EV − PV | below 0 | Is the planned work done? |
| Cost variance | CV = EV − AC | below 0 | Did the work done cost more than its budget? |
| Schedule performance index | SPI = EV / PV | below 1 | How much of the planned work gets done |
| Cost performance index | CPI = EV / AC | below 1 | How much work each dollar buys |
The variances are in money. The indices are ratios, so you can compare a small project with a big one. Time and cost are two separate questions, and the four projects on the page show all four answers. At week 5 every one of them has PV = 52.
| Project at week 5 | EV | AC | SV | CV | SPI | CPI |
|---|---|---|---|---|---|---|
| A on plan | 52 | 52 | 0 | 0 | 1.00 | 1.00 |
| B on schedule, over budget | 52 | 65 | 0 | −13 | 1.00 | 0.80 |
| C behind, under budget | 38 | 30.4 | −14 | +7.6 | 0.73 | 1.25 |
| D behind and over budget | 38 | 47.5 | −14 | −9.5 | 0.73 | 0.80 |
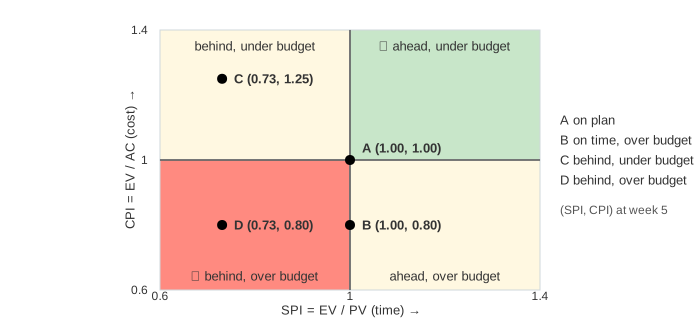
Project B does the planned work on time, but every $k of work costs 1.25 (overtime, dearer staff): CPI = 52 / 65 = 0.80 (Demo: on schedule, over budget). Project C has fewer, cheaper people. It is late, SPI = 38 / 52 = 0.73, but each dollar buys more: CPI = 38 / 30.4 = 1.25 (Demo: behind, under budget).
Forecasting the final cost: EAC, ETC and VAC
The estimate at completion assumes the rest of the work will cost what the work so far did: EAC = BAC / CPI. The estimate to complete is what is still to be spent, ETC = EAC − AC. The variance at completion, VAC = BAC − EAC, is how far the final cost lands from the budget.
| Project at week 5 | EAC | ETC | VAC |
|---|---|---|---|
| A | 100 | 48 | 0 |
| B | 100 / 0.80 = 125 | 125 − 65 = 60 | −25 |
| C | 100 / 1.25 = 80 | 80 − 30.4 = 49.6 | +20 |
| D | 100 / 0.80 = 125 | 125 − 47.5 = 77.5 | −25 |
The forecast works early. Project B at week 2 has done only 10 of 100, yet CPI is already 0.80, so EAC is already 125 (Demo: early warning at 10% done). Studies of large defence projects found that CPI changes little once a project is about 20% done, so an early overrun rarely goes away by itself. On this page every project keeps its CPI, so each forecast comes true: B ends at 125, C at 80.
BAC / CPI is only one choice. If the overrun was a one-off and the rest will go to plan, use EAC = AC + (BAC − EV). If both late and over budget will keep hurting, use EAC = AC + (BAC − EV) / (CPI × SPI). The to-complete performance index, TCPI = (BAC − EV) / (BAC − AC), is the CPI the rest of the project would need to land on budget. For B at week 5 it is 48 / 35 = 1.37, much better than the 0.80 so far, so hoping is not a plan. The canvas also gives a rough end date, planned duration ÷ SPI: 10 / 0.73 ≈ 13.7 weeks for C.
SPI at the end of a late project
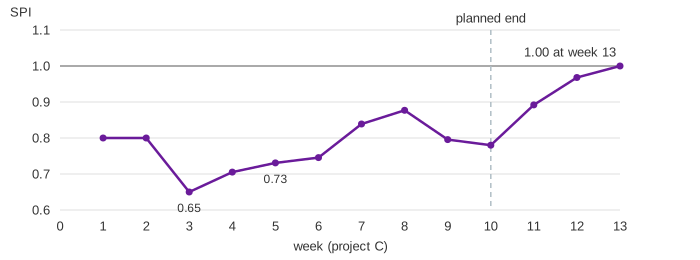
Run project C to the end. It finishes in week 13, three weeks late. Yet at week 13 PV = EV = BAC = 100, so SV = 0 and SPI = 1.00 (Demo: a late project at the end). After the planned end, PV cannot grow, and EV catches up with it. So SPI drifts back to 1 near the end, whatever the delay. For the last third of a project, look at dates, not SPI.
Agile teams can use the same idea: the Product Backlog is the BAC in story points, and the points Done are the EV. See also a Scrum Sprint and its burndown chart, where points count only when an item is Done.
What the page leaves out
How % complete is measured in practice (0/100, 50/50 and milestone rules, which stop people from claiming 90% done for weeks); the work breakdown structure and control accounts; management reserve and contingency; the performance measurement baseline and how it is re-planned; earned schedule, which measures delay in weeks and fixes the SPI problem near the end; a CPI that changes from week to week (here each project keeps one CPI, so the forecasts are exact); the US EIA-748 standard for EVM systems; and how AC is collected from timesheets and invoices.