The idea: a pen that goes round six times
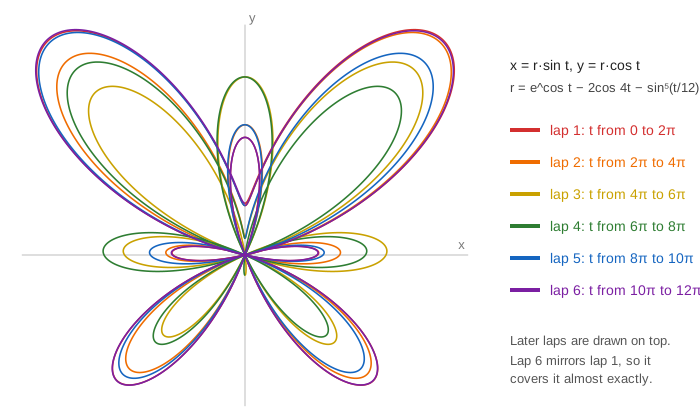
In 1989 Temple Fay published a curve that looks like a butterfly. A pen moves round the origin; at time t it points in direction t and sits at distance r(t) from the origin. After t = 2π it has gone round once (one lap). It keeps going to t = 12π, six laps, and the six laps together draw the wings.
The formula
The page uses the usual parametric form:
r(t) = e^cos t − 2cos 4t − sin⁵(t/12)
x = r(t)·sin t        y = r(t)·cos t        0 ≤ t ≤ 12π
This is polar coordinates with one twist: the angle is measured from the y-axis and turns clockwise (sin and cos swapped), so t = 0 points straight up and the butterfly stands upright with its body on the y-axis. Fay's own polar form, r = e^sin θ − 2cos 4θ + sin⁵((2θ − π)/24) with x = r cos θ, y = r sin θ, is exactly the same curve: put θ = π/2 − t and every piece turns into the one above.
The page keeps t in steps of π/30 (60 steps per lap, 361 frames for 0 → 12π) and draws the curve through 960 points per lap, so it stays smooth even in the tight loops near the body.
Term by term
| term | range | repeats every | what it draws |
|---|---|---|---|
| e^cos t | 1/e ≈ 0.37 to e ≈ 2.72 | 2π (one lap) | one egg-shaped loop, big at the top (t = 0), small at the bottom (t = π) |
| − 2cos 4t | −2 to 2 | π/2 (4 per lap) | 4 swings per lap: the wings, and r < 0 at times |
| − sin⁵(t/12) | −1 to 0 on 0 … 12π | 24π | a slow pull inward that is different in each lap |
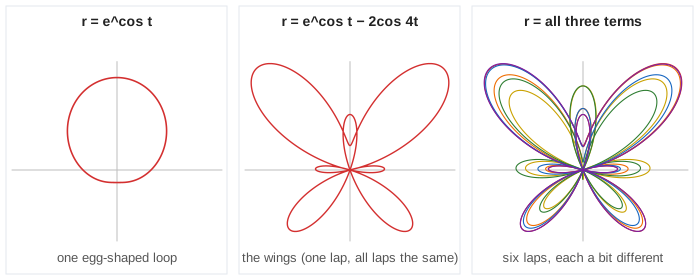
With only e^cos t the pen draws a closed loop: e ≈ 2.72 above the origin at t = 0, 1/e ≈ 0.37 below it at t = π. Every lap draws the same loop again, so after two laps you still see one loop (in lap 2's colour, on top). (Demo: first term only: e^cos t is one egg-shaped loop.)
Adding − 2cos 4t gives the butterfly shape at once. cos 4t has period π/2, so it swings r up and down 4 times per lap: big at the sides (the wings), small or negative at the top and bottom. But both terms repeat every 2π, so lap 2 lands exactly on lap 1. (Demo: two terms: lap 2 lands exactly on lap 1.)
Negative r: the pen crosses the origin
At t = 0, r = e − 2 = 0.72; at t = π, r = 1/e − 2 ≈ −1.63. A negative r means "go the other way": the direction t = π points down, so r = −1.63 puts the pen 1.63 above the origin. Each time r passes through 0 the pen goes through the origin and keeps drawing on the far side. That is where the small loops near the body come from. The grey ray on the canvas joins the origin to the pen, so you can see it flip. cos 4t on its own, r = cos 4t, is an 8-petal rose curve for the same reason.
Why the laps differ: sin⁵(t/12)
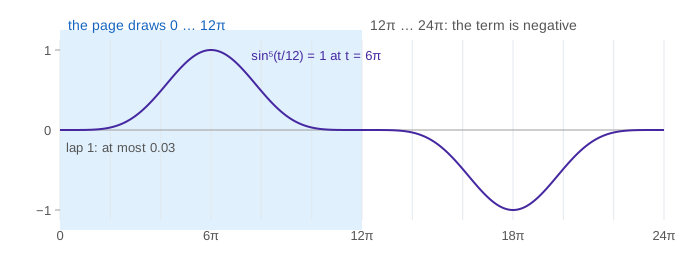
The last term changes slowly: sin(t/12) needs 24π to repeat, so across the whole picture (0 … 12π) it rises once from 0 to 1 and falls back. The 5th power keeps it close to 0 most of the time and makes the hump narrow:
| t | 0 | 2π | 4π | 6π | 8π | 10π | 12π |
|---|---|---|---|---|---|---|---|
| sin⁵(t/12) | 0 | 0.03 | 0.49 | 1 | 0.49 | 0.03 | 0 |
Inside one lap it hardly changes, so it acts like "shrink r by about this much in this lap": almost nothing in laps 1 and 6, up to 1 in laps 3 and 4. That is why the laps no longer repeat and run side by side instead. The strip plot on the canvas shows the three terms over 0 … 12π with a cursor at t. (Demo: term by term: e^cos t, then − 2cos 4t, then − sin⁵(t/12).)
There is a neat symmetry too: sin((12π − t)/12) = sin(t/12), so lap 6 is lap 1 mirrored about the y-axis, lap 5 mirrors lap 2 and lap 4 mirrors lap 3. That is why the butterfly comes out symmetric.
12π or 24π?
e^cos t and cos 4t repeat every 2π, but sin(t/12) only every 24π, so r(t) as a whole repeats every 24π. The usual picture stops at 12π, where sin(t/12) is back at 0 and the pen is back at its start (0, 0.72), so the drawing is closed. From 12π to 24π the last term is negative and pushes r out instead of in: 6 more laps, a little bigger. The page draws the classic 0 … 12π. (Demo: the full butterfly, t from 0 to 12π; Demo: one lap, t from 0 to 2π.)
Another curve built from a simple shape plus a wiggle is the heart curve, and the superformula makes many such shapes with one polar formula.
What the page leaves out
t from 12π to 24π (the second half of the period), arc length and area, why the exponent is 5 (other odd powers give a wider hump and laps that spread more), and the many variants with other constants. The window is fixed at x ∈ [−3.3, 3.3], y ∈ [−2.5, 3.6].