The idea: add the same step, or multiply by the same ratio
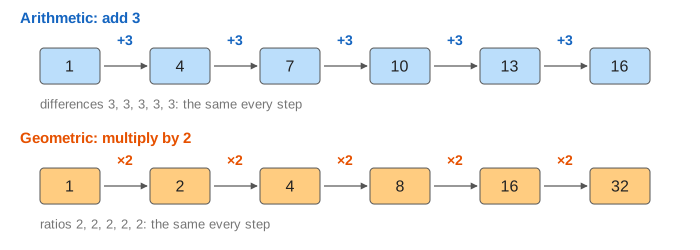
A sequence is a list of numbers a₁, a₂, a₃, … where each one is made from the one before by the same rule. The two simplest rules are "add d" and "multiply by r".
| arithmetic | geometric | |
|---|---|---|
| rule | aₙ₊₁ = aₙ + d | gₙ₊₁ = gₙ · r |
| term n | aₙ = a₁ + (n − 1)·d | gₙ = g₁ · rⁿ⁻¹ |
| what stays the same | the common difference d | the common ratio r |
| sum of n terms | n(a₁ + aₙ)/2 | g₁(1 − rⁿ)/(1 − r), r ≠ 1 |
| graph against n | points on a straight line | points on an exponential curve |
On the canvas each new term is one small story: a +d chip and a ×r chip appear at term n − 1, fly to term n, and the new values land in the boxes and as dots on the chart.
Arithmetic: equal differences
Starting at a₁ and adding d n − 1 times gives aₙ = a₁ + (n − 1)·d. Plotted against n that is a line with slope d: the sequence is a linear function looked at only at whole numbers. To test data, subtract neighbours: if every difference is the same, it is arithmetic.
The sum has a short cut that Gauss is said to have found as a schoolboy. Write the terms forwards and backwards; each pair adds to a₁ + aₙ, and there are n of them, counted twice, so the sum is n(a₁ + aₙ)/2. For 1, 4, 7, …, 28 that is 10 · 29 / 2 = 145.
Geometric: equal ratios
Starting at g₁ and multiplying by r n − 1 times gives gₙ = g₁ · rⁿ⁻¹. To test data, divide neighbours: if every ratio is the same, it is geometric. The step from one term to the next is gₙ₊₁ − gₙ = (r − 1)·gₙ, so it grows as the terms grow: that is what makes the curve bend up.
- r > 1: growth. Doubling 1, 2, 4, … reaches 512 by term 10.
- 0 < r < 1: decay. Halving 64, 32, 16, … gets as close to 0 as you like but never reaches it, while subtracting 8 from 64 reaches 0 at term 9 and goes below (Demo: halving never reaches 0).
- r = 1 (and d = 0 for arithmetic): every term is the same.
- r < 0: the sign flips every step: 1, −2, 4, −8, … (Demo: r = −2 flips the sign).
The sum is g₁(1 − rⁿ)/(1 − r): multiply the sum by r, subtract, and everything but the first and last term cancels. 1 + 2 + 4 + … + 512 = 1023. What happens to the sum when n never stops is on Geometric Series.
Who wins: the crossover
For any r > 1 and any d, the geometric sequence ends up ahead, however small it starts. Its step (r − 1)·gₙ keeps growing, while the arithmetic step stays d. The Numbers panel shows the first n with gₙ > aₙ.
| demo | a₁₀ | g₁₀ | first n with gₙ > aₙ |
|---|---|---|---|
| add 3 vs multiply by 2 | 28 | 512 | 5 |
| 100 + 10 per step vs 1 × 2 per step | 190 | 512 | 9 |
| 10 + 10 per step vs 10 × 3/2 per step | 100 | 384.434 | 5 |
A head start only delays the crossover (Demo: a head start of 100 does not help), and a ratio just above 1 only slows it down (Demo: r = 3/2 is slow but still wins). This is the same race as linear vs exponential running time on Big-O Growth.
A log axis straightens the geometric one
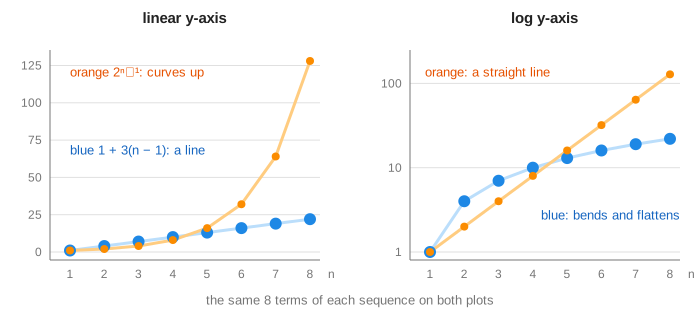
On a log y-axis equal ratios are equal distances, so ×r every step becomes a straight line, and +d every step becomes a curve that flattens, because adding d is a smaller and smaller ratio as the terms grow (Demo: a log axis makes ×r a straight line; the y-axis select is under Options).
Sequences are sampled functions
An arithmetic sequence is a linear function y = mx + b read at x = 1, 2, 3, … (see Linear Functions). A geometric sequence with r > 0 is an exponential y = a·bˣ read at whole numbers, with b = r (see Exponential Graphs: What a, b, h, k Do and Exponentials and Logarithms). Simple interest grows arithmetically; compound interest grows geometrically.
What the page leaves out
Infinite sums and convergence, sequences given by other rules (Fibonacci, squares, harmonic), arithmetic-geometric products like n·rⁿ, and terms beyond n = 10. The starting values, d and r come from short lists so that the chart stays readable.